2023 Profitability of Coworking Spaces

2023 Profitability of Coworking Spaces
Can operators get rich from coworking spaces in the post-Covid world, or are their businesses just burning money? That depends. The latter is certainly easier than the former. Come prepared to study the differences between profitable and unprofitable coworking spaces. Get detailed visuals on more than 170 slides.

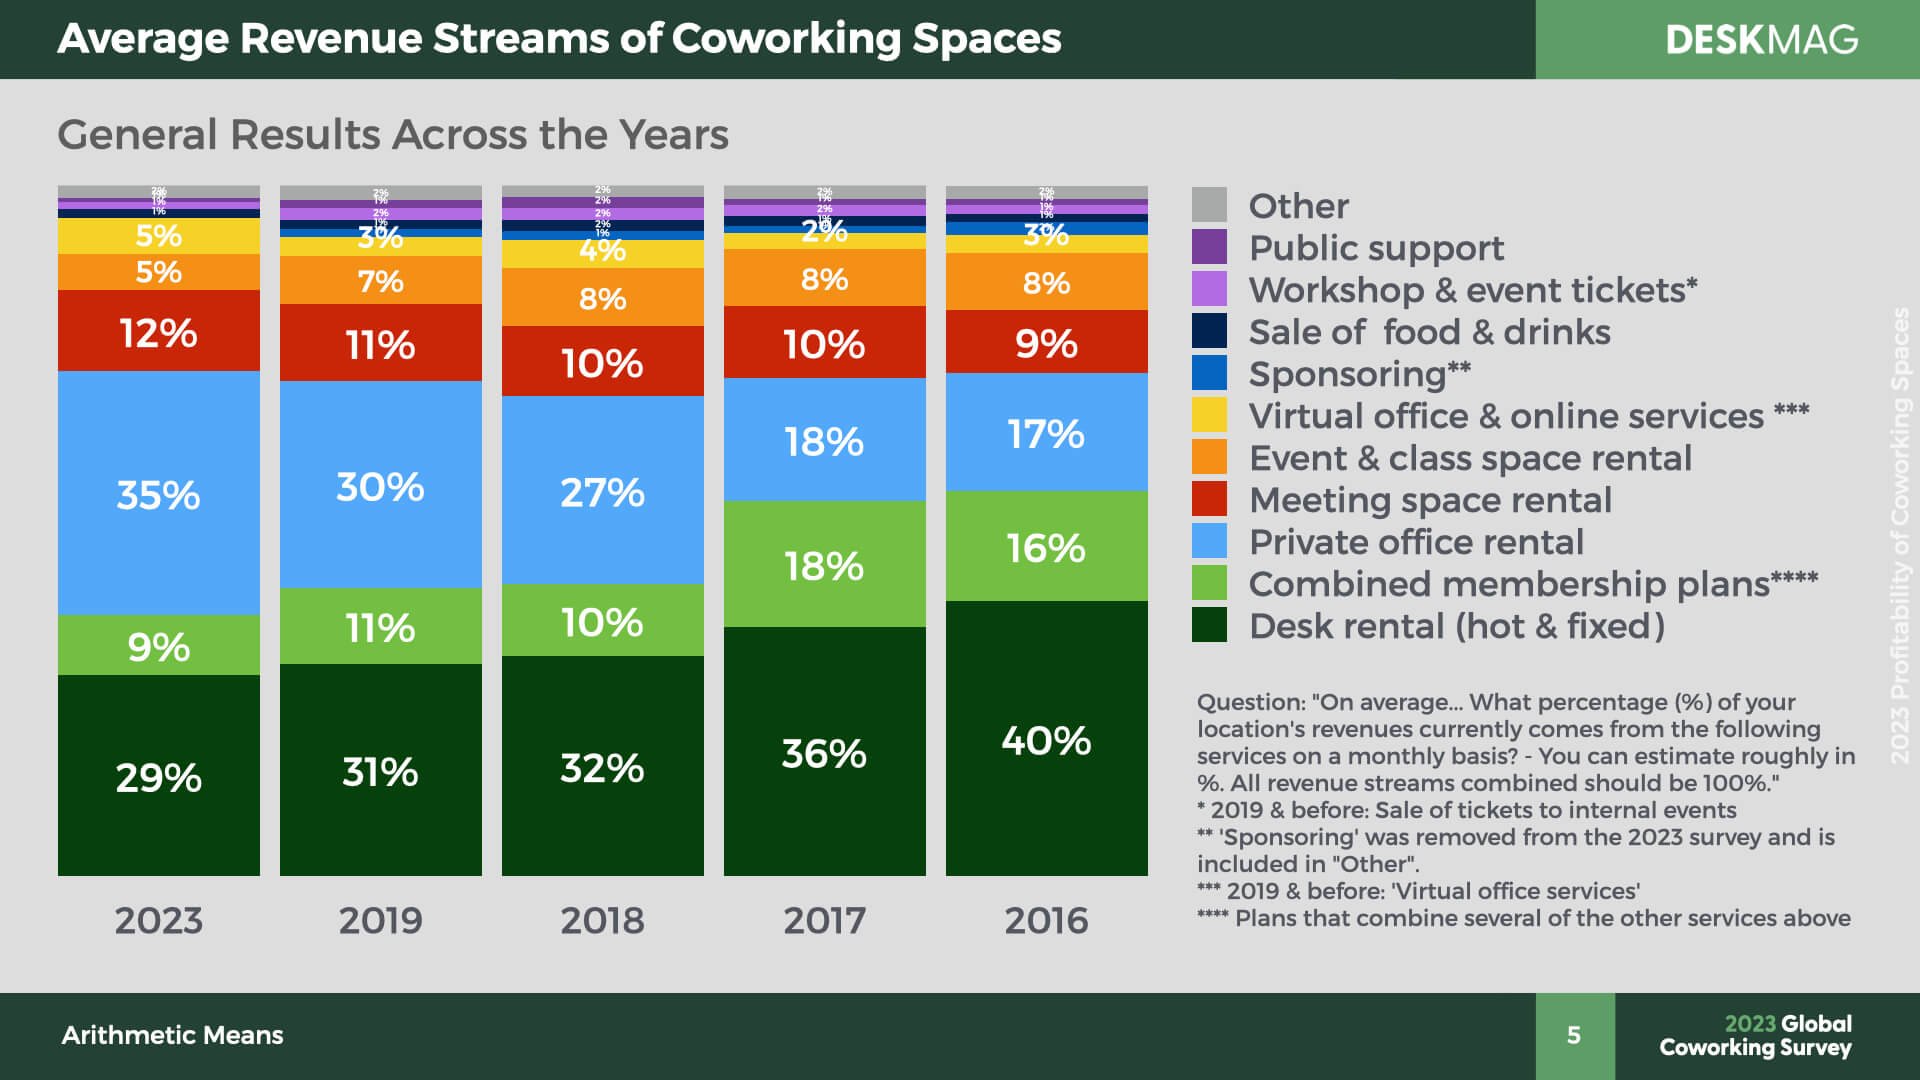

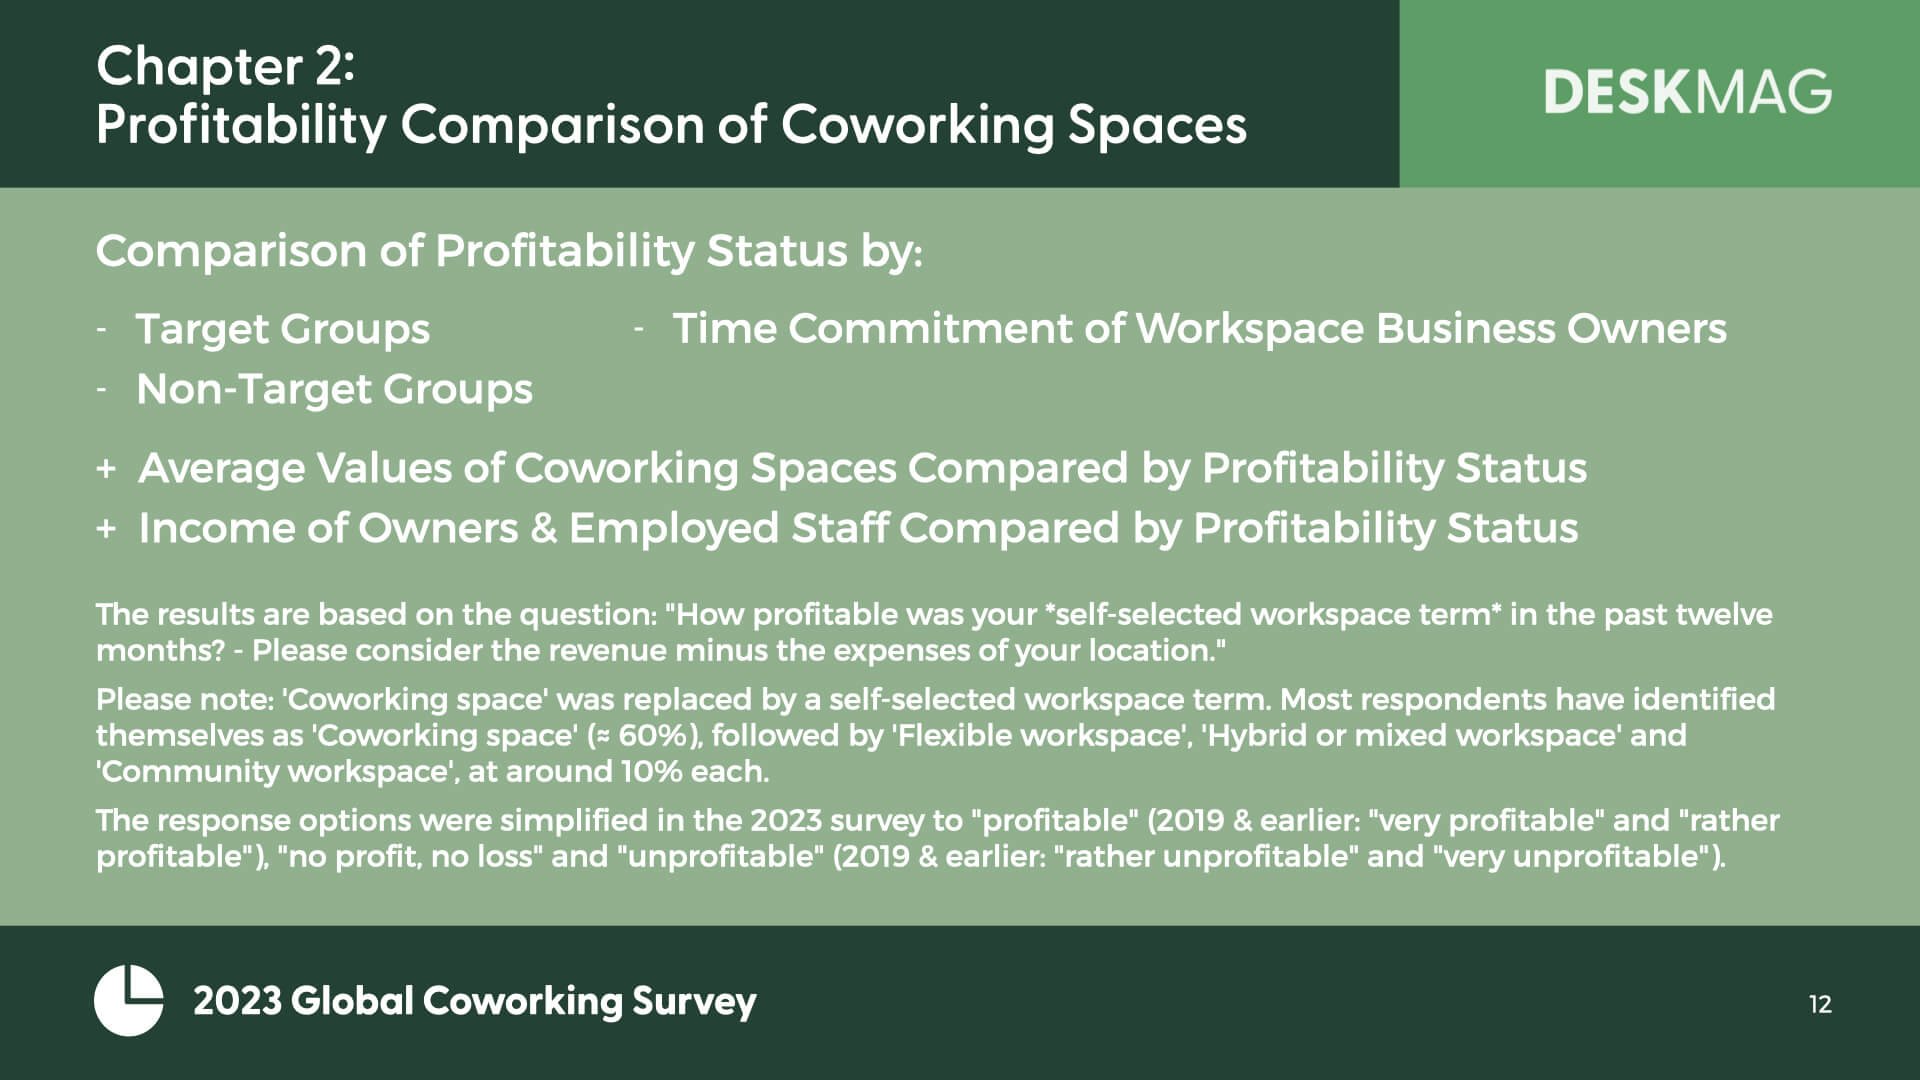
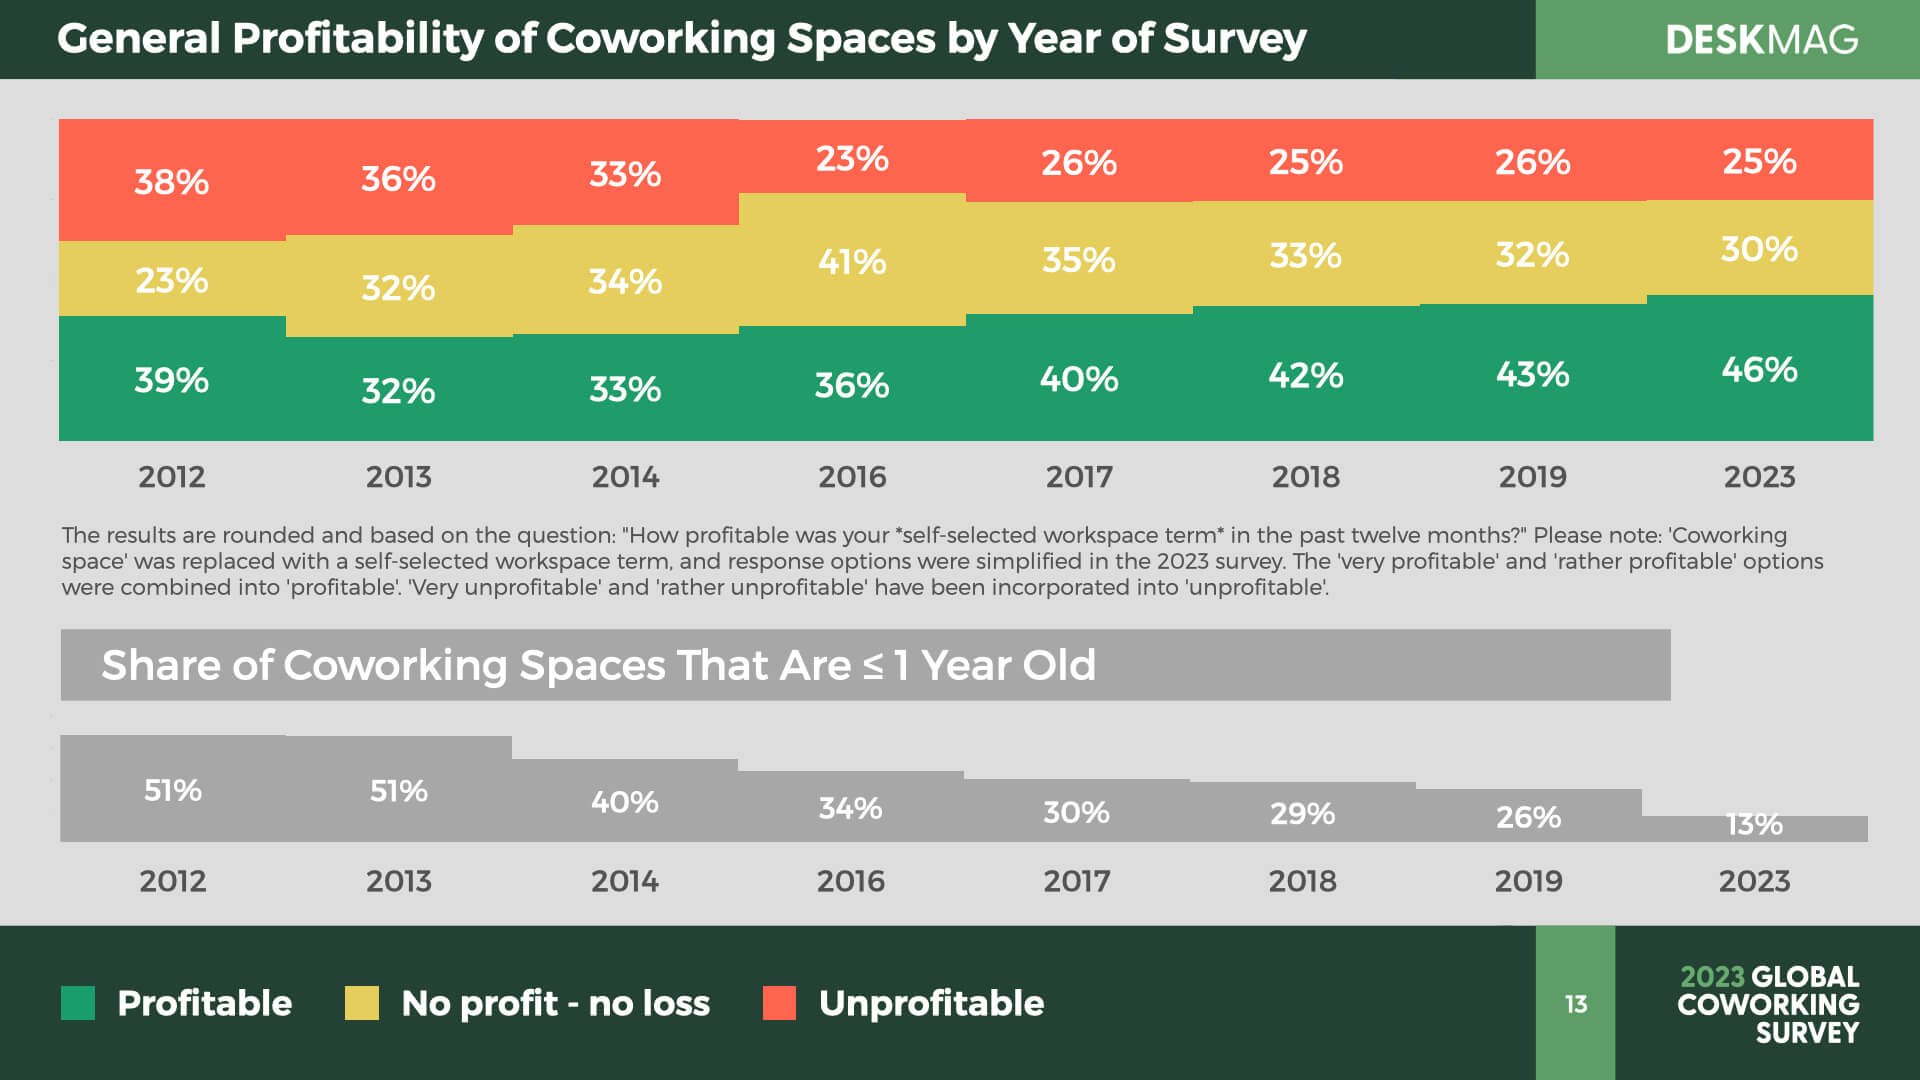
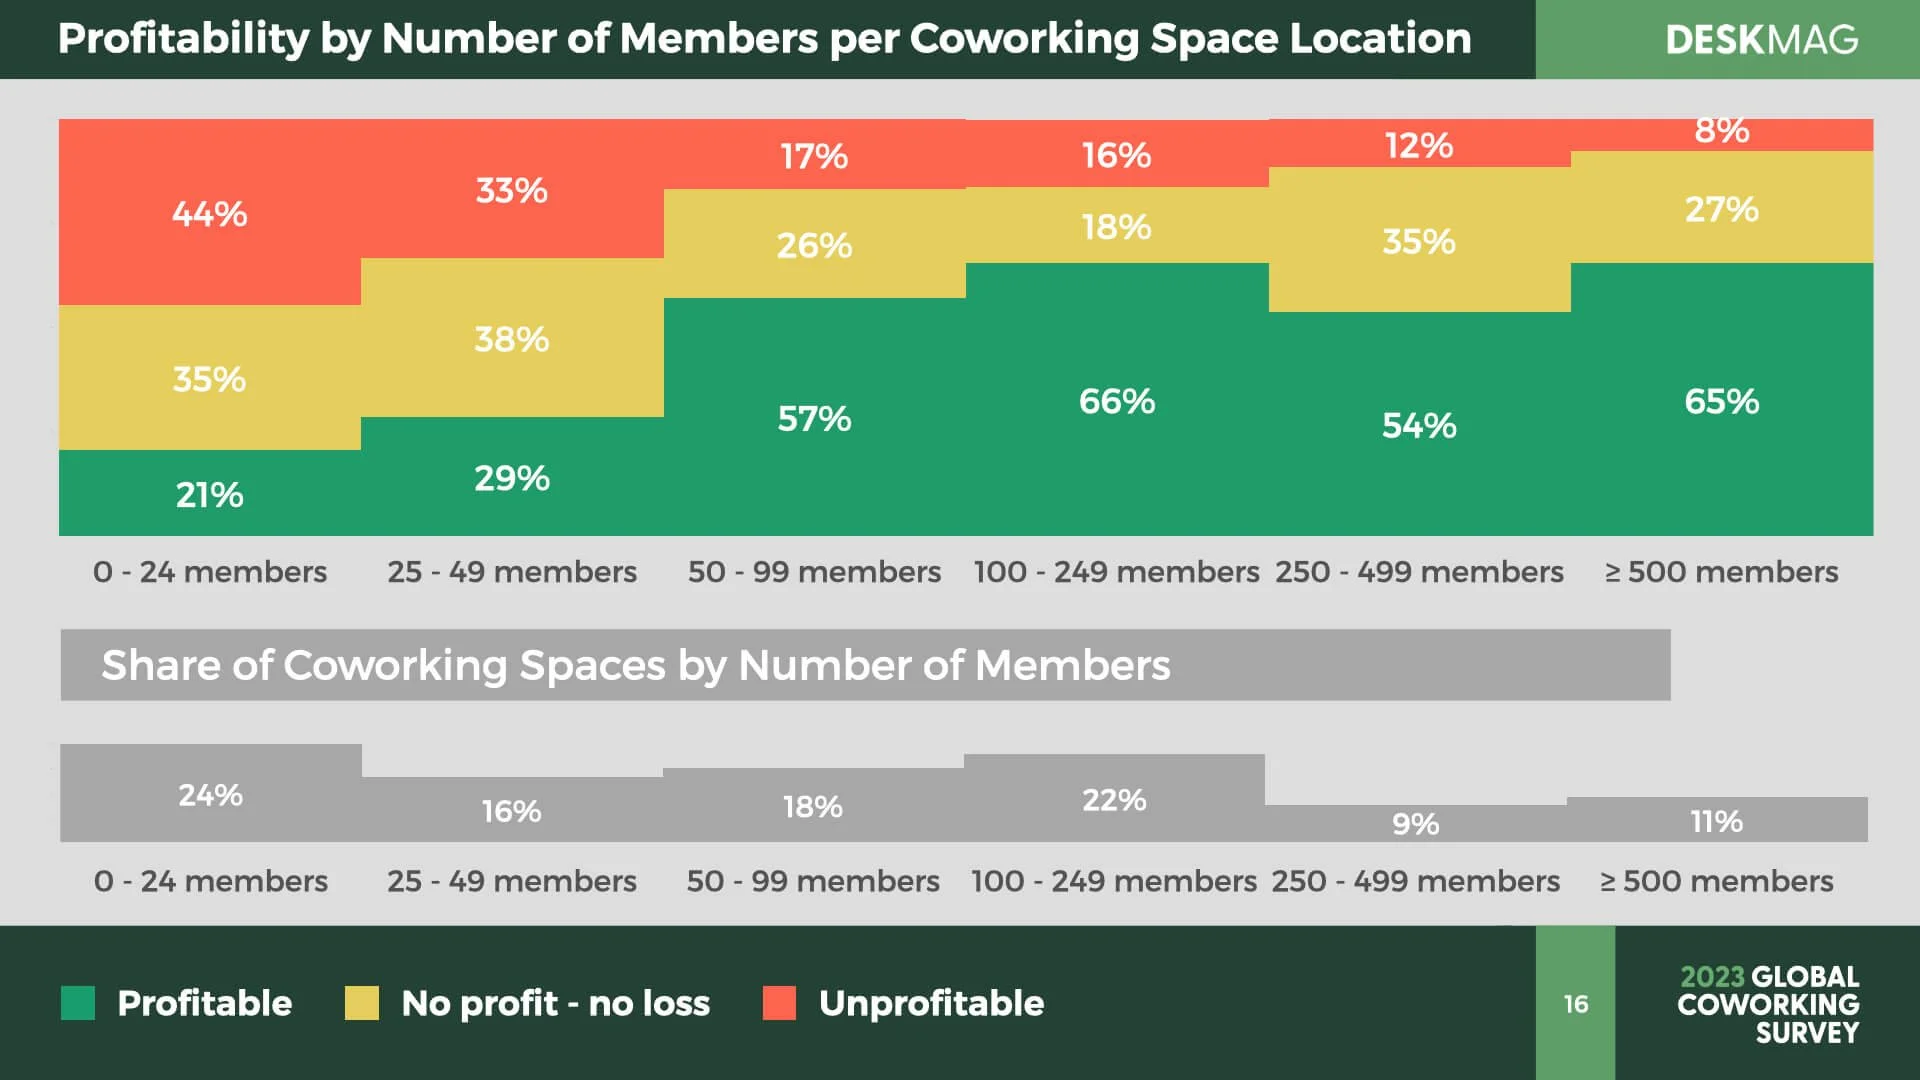
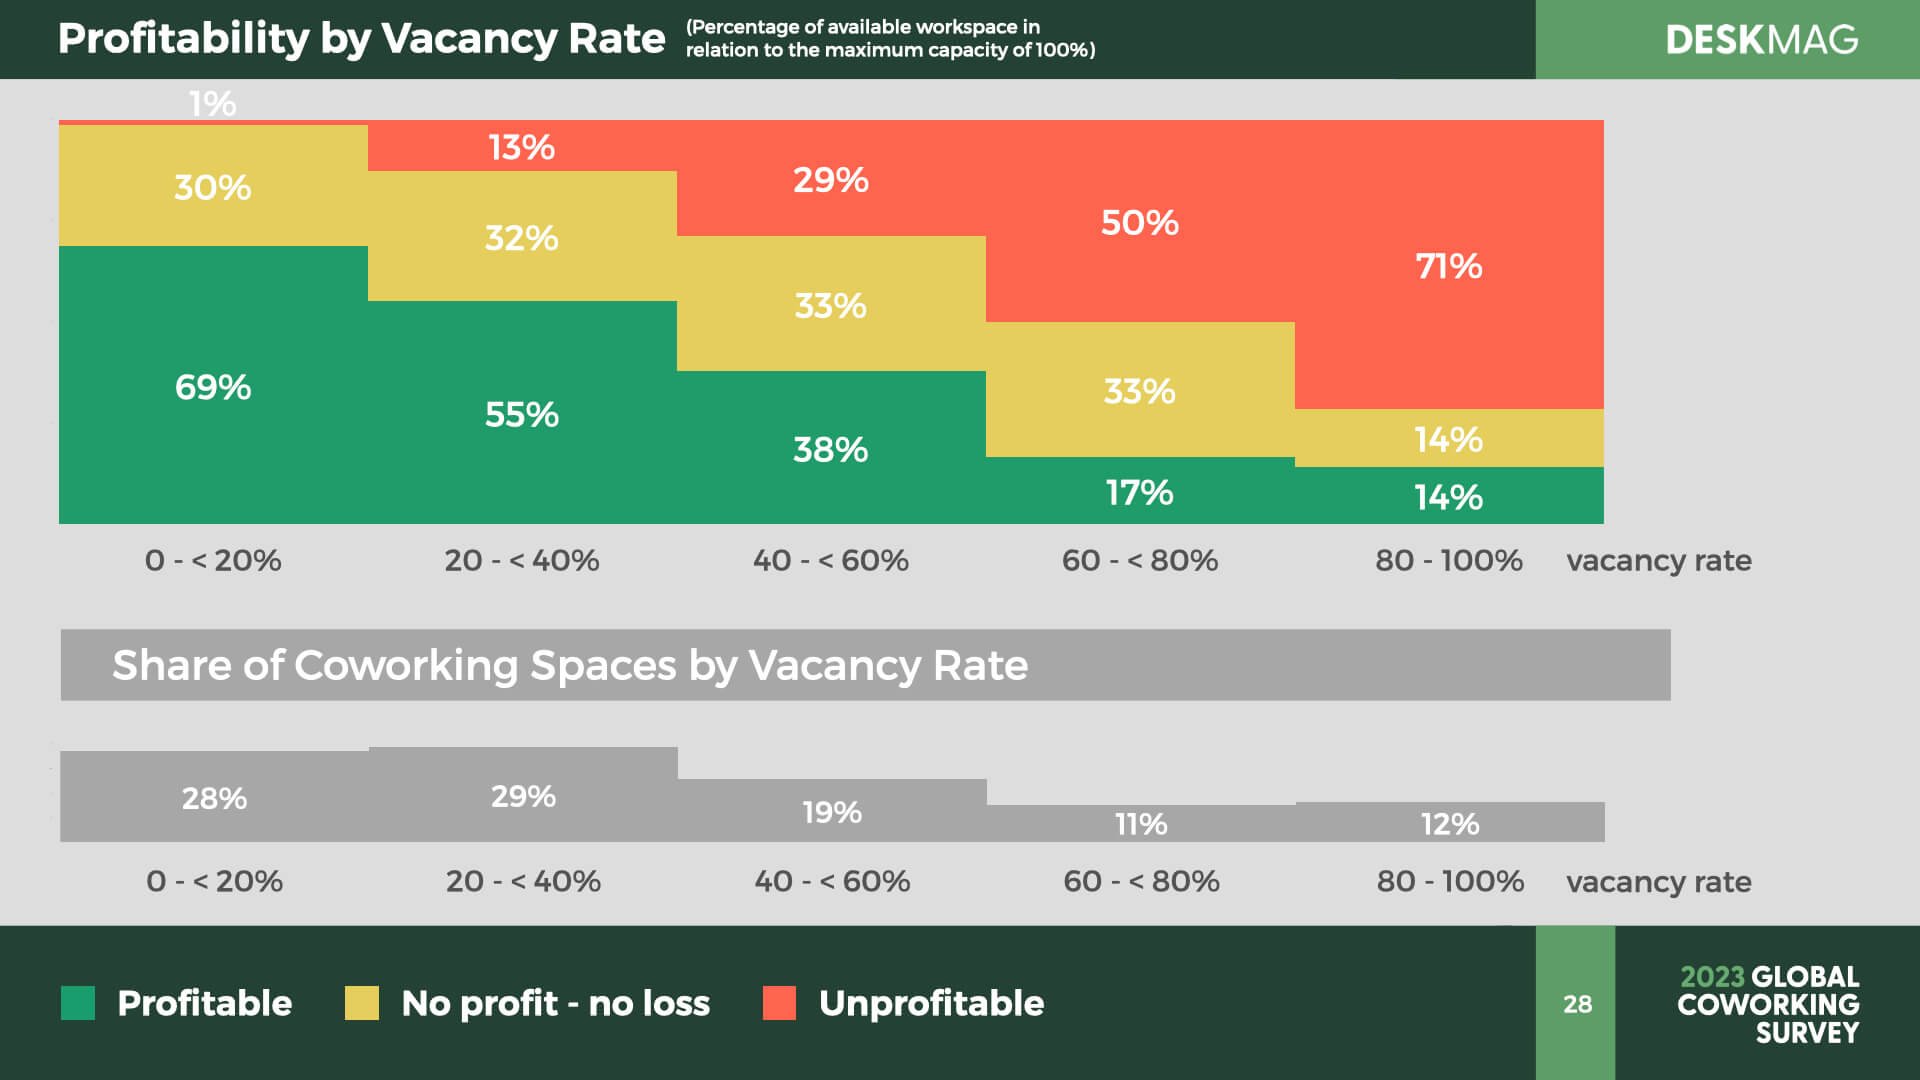
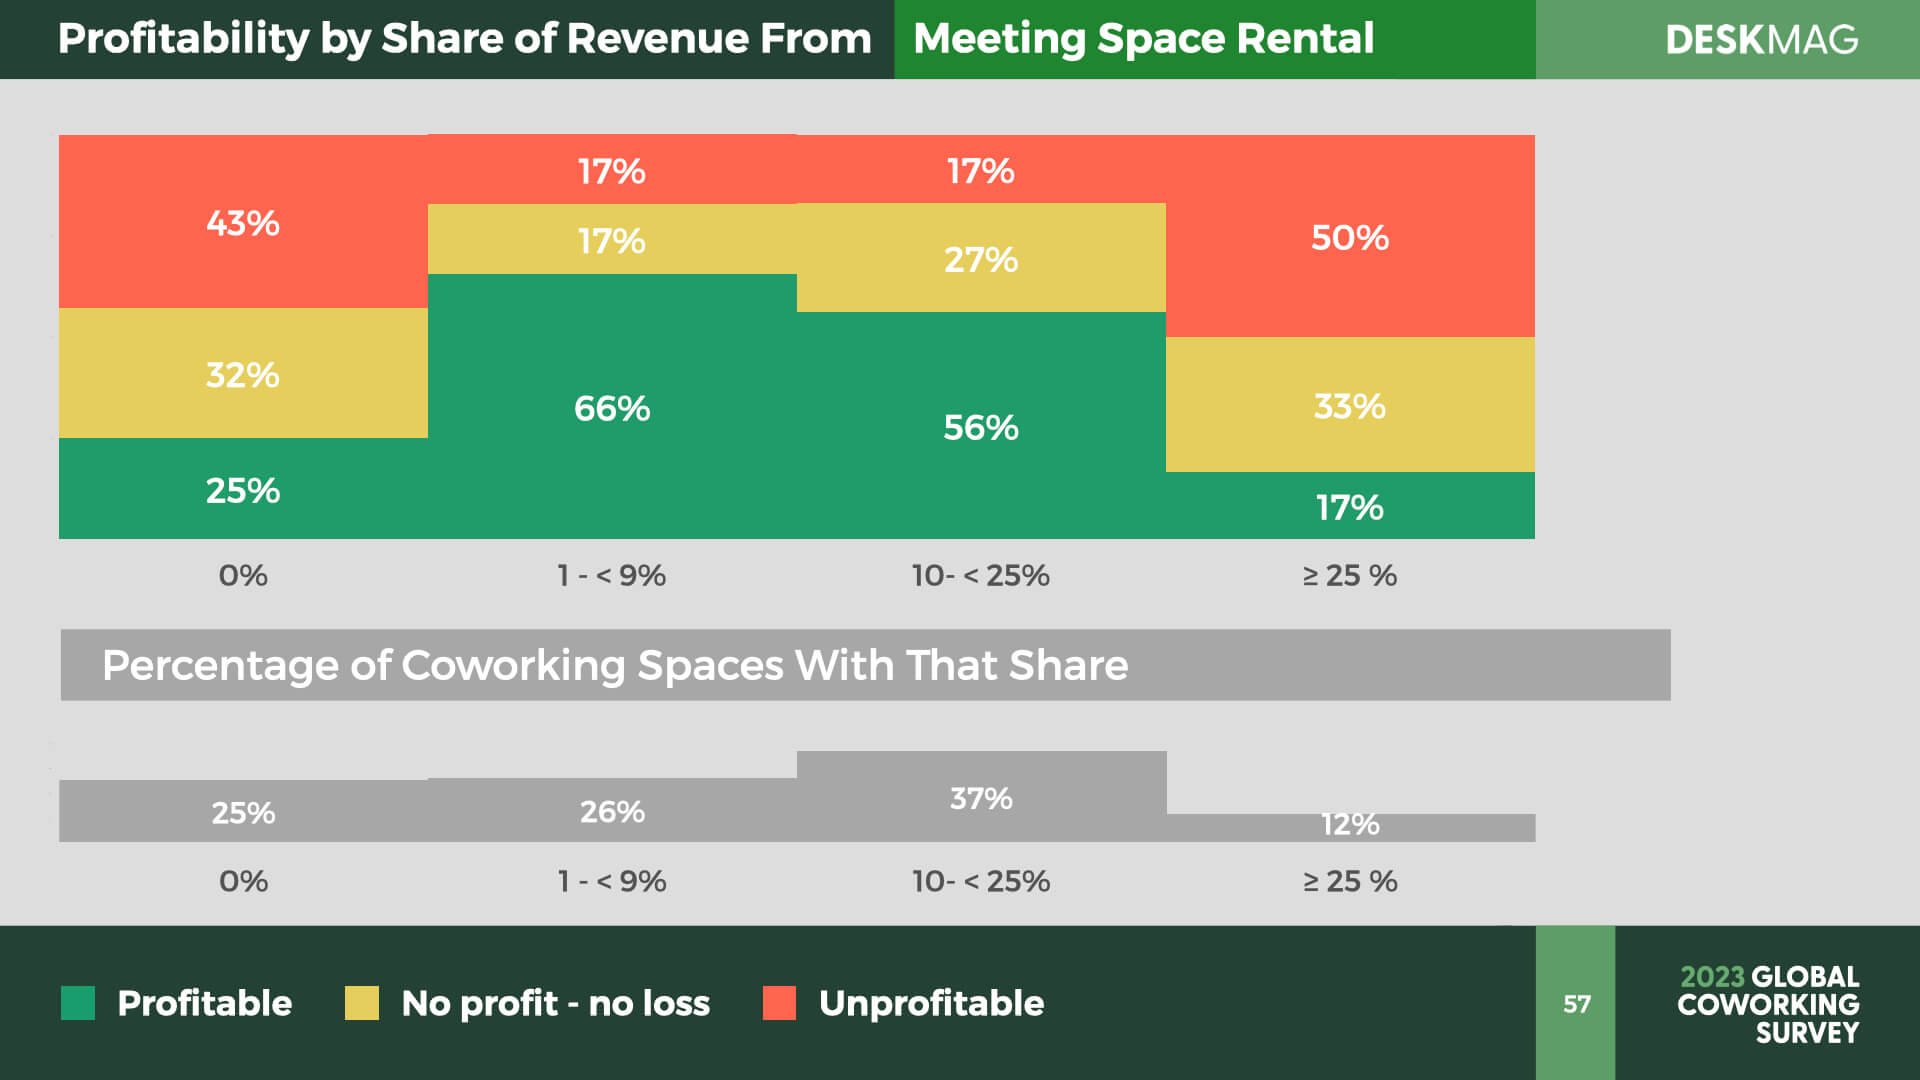
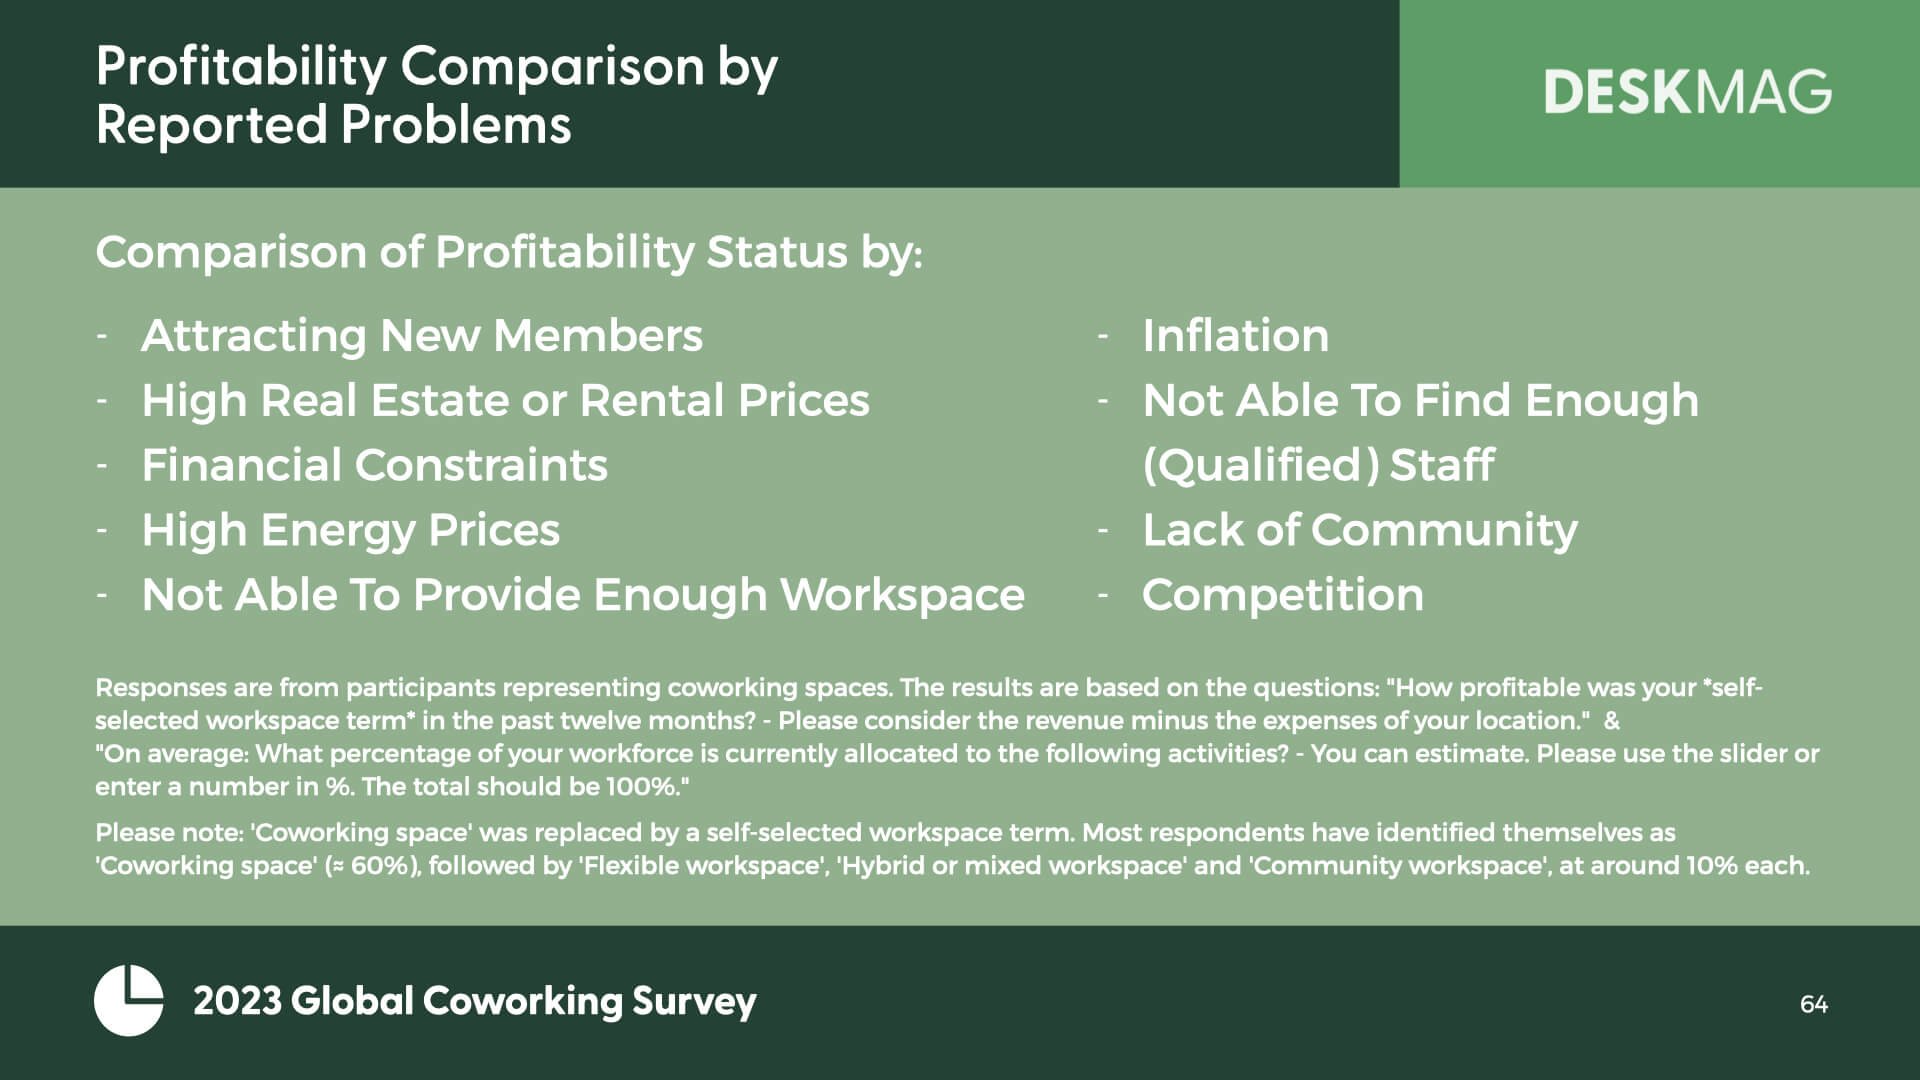
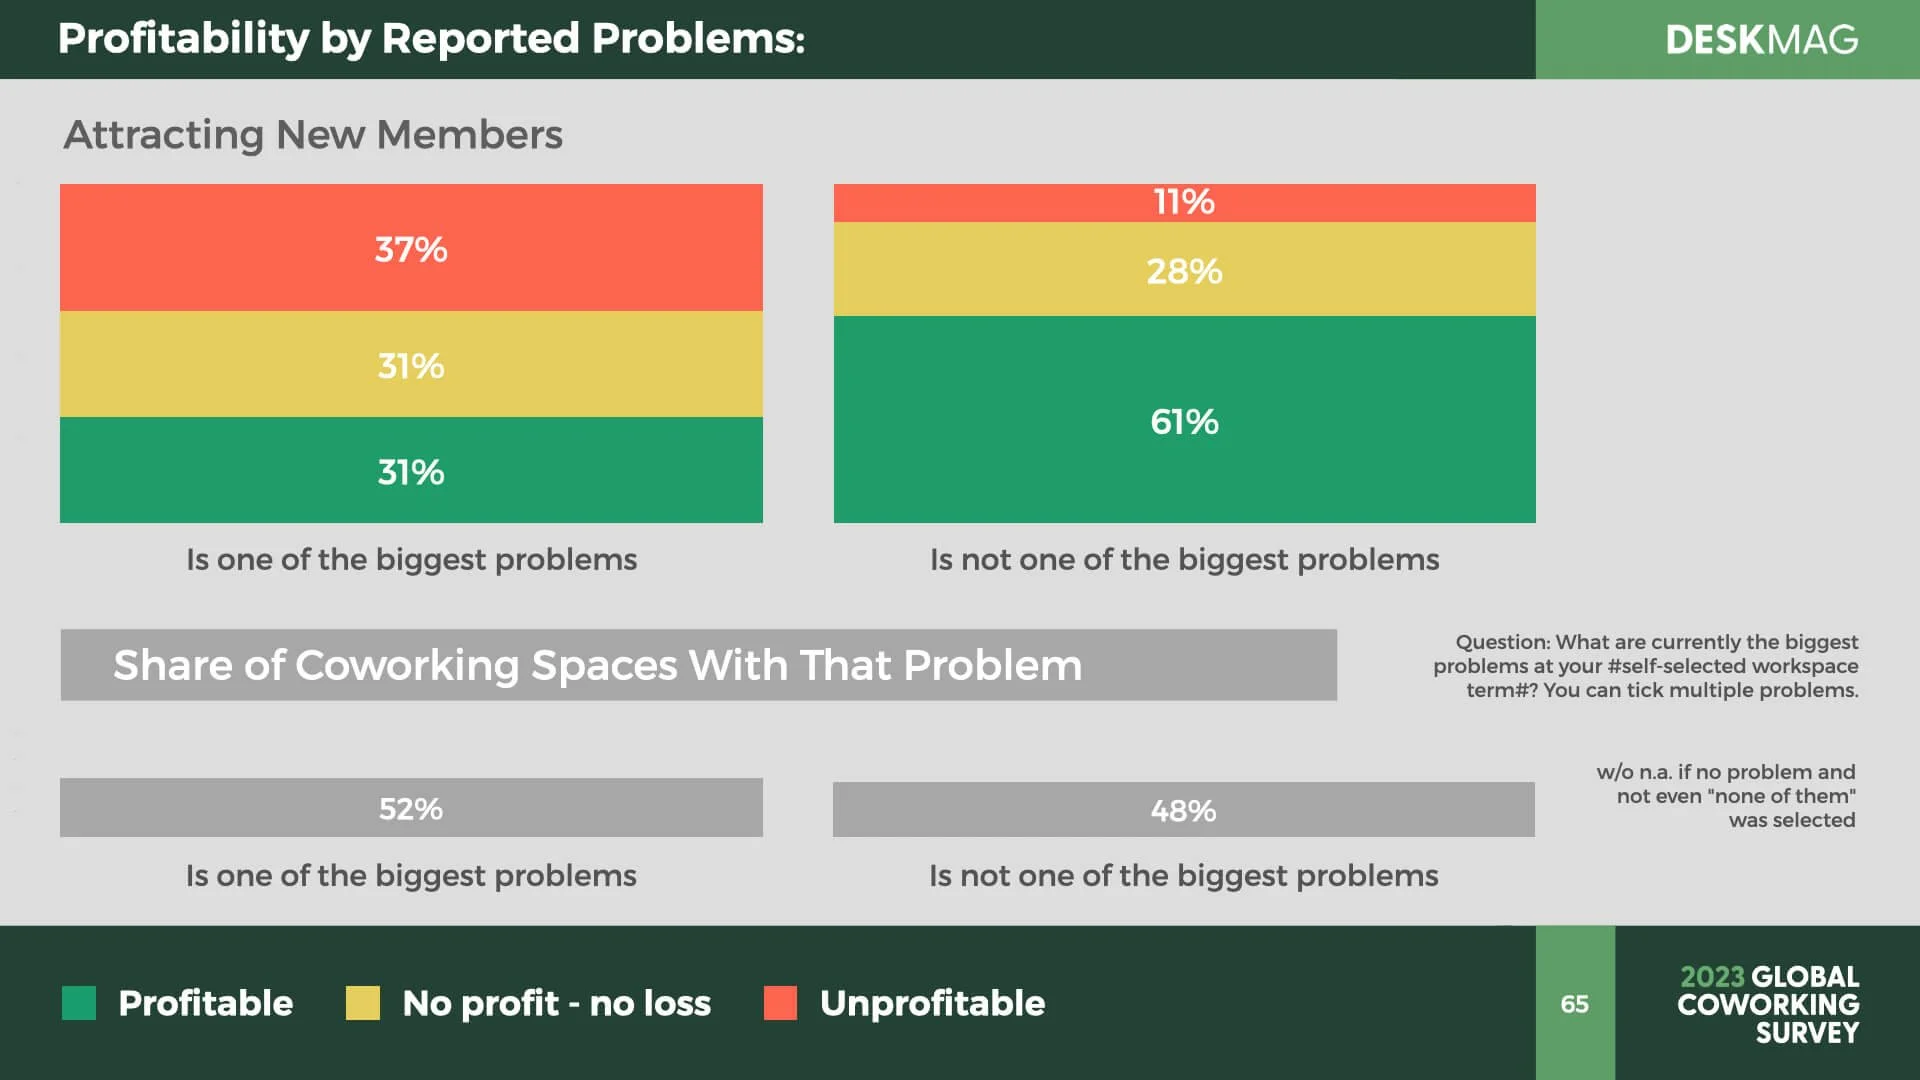
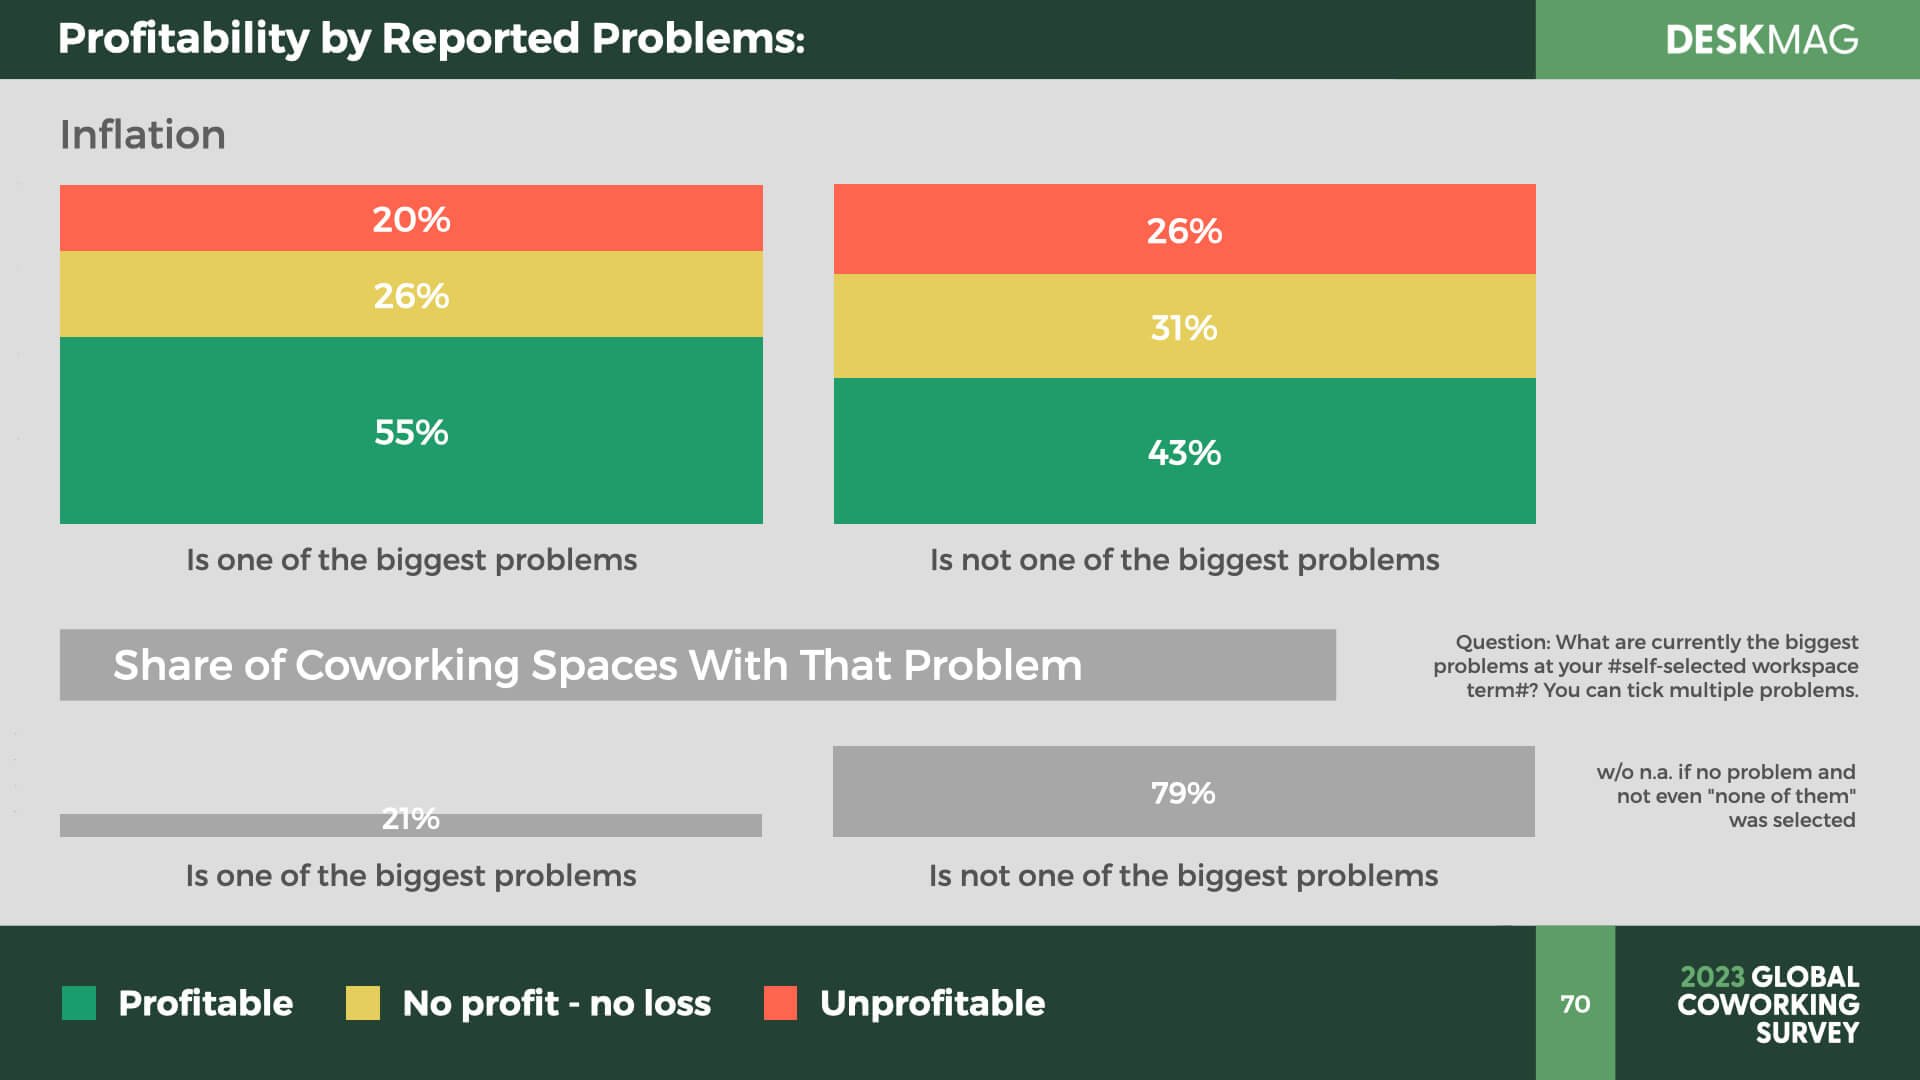

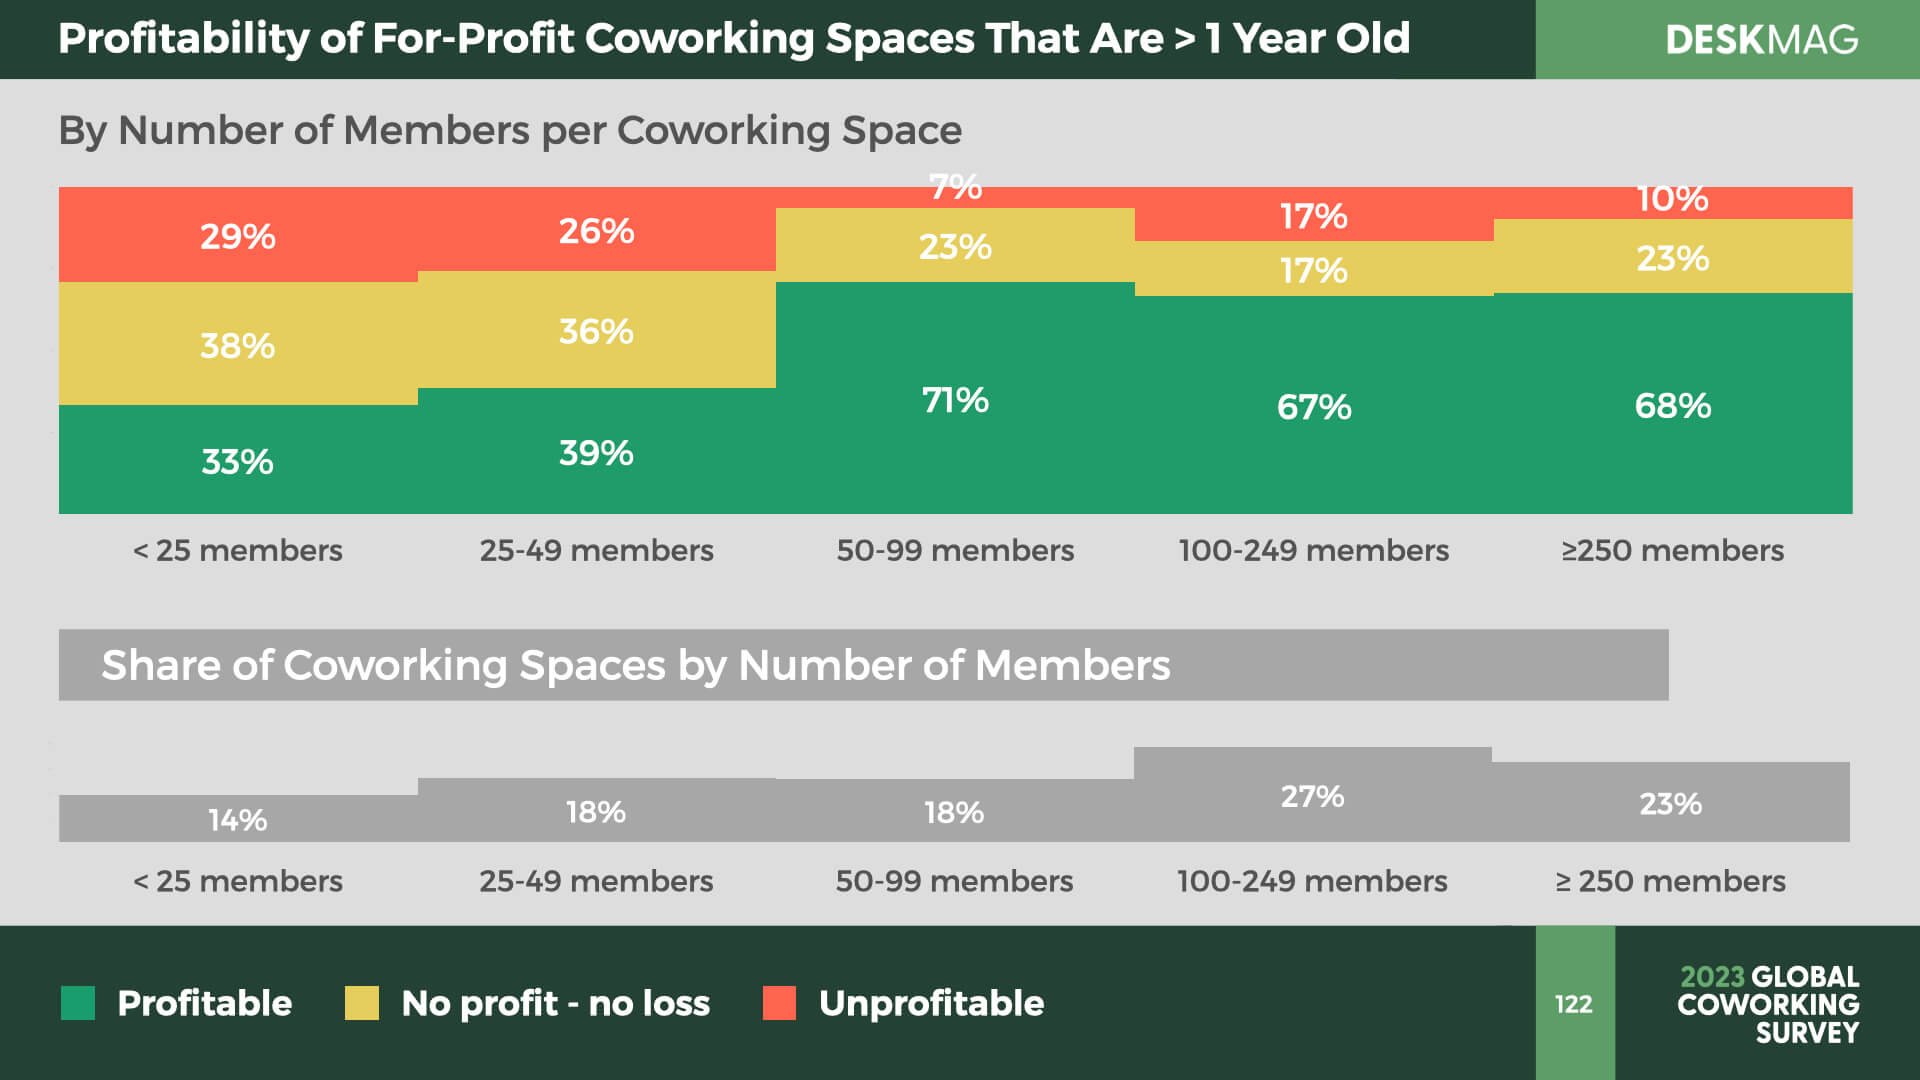
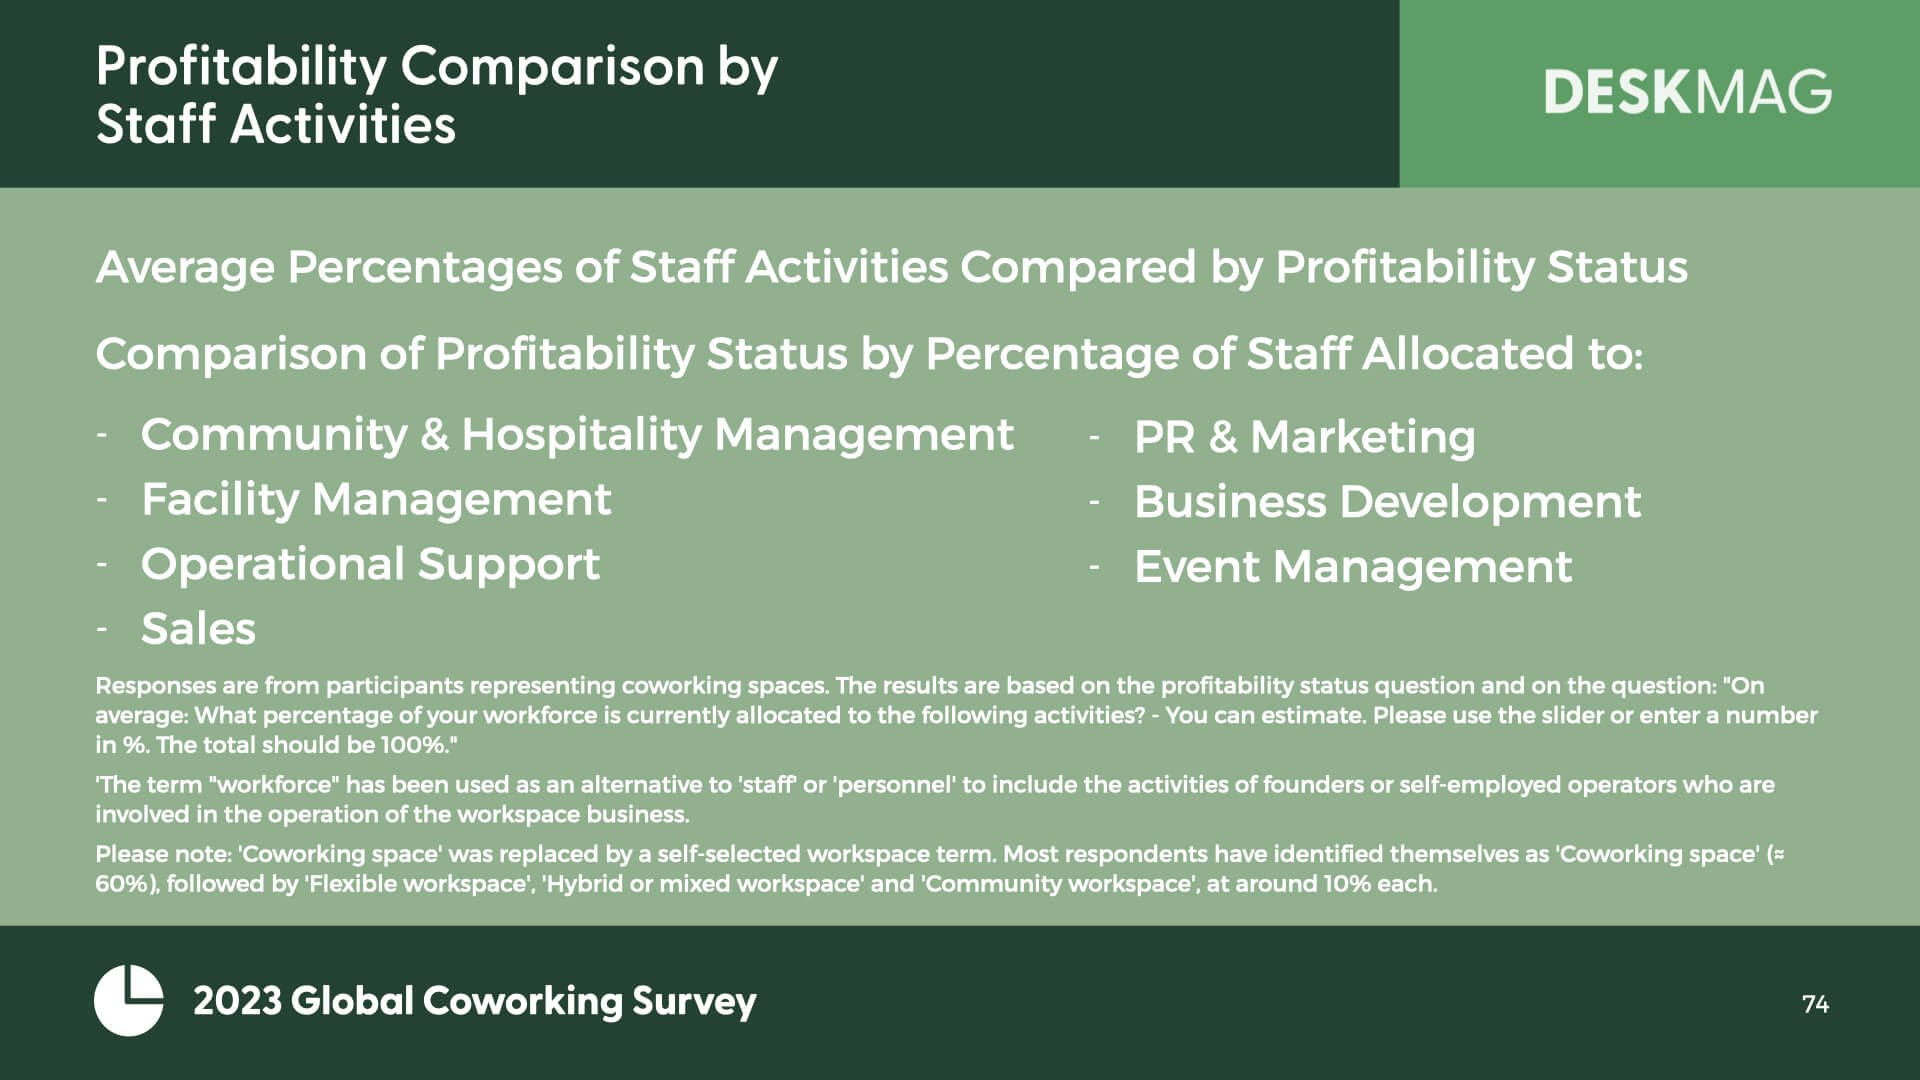
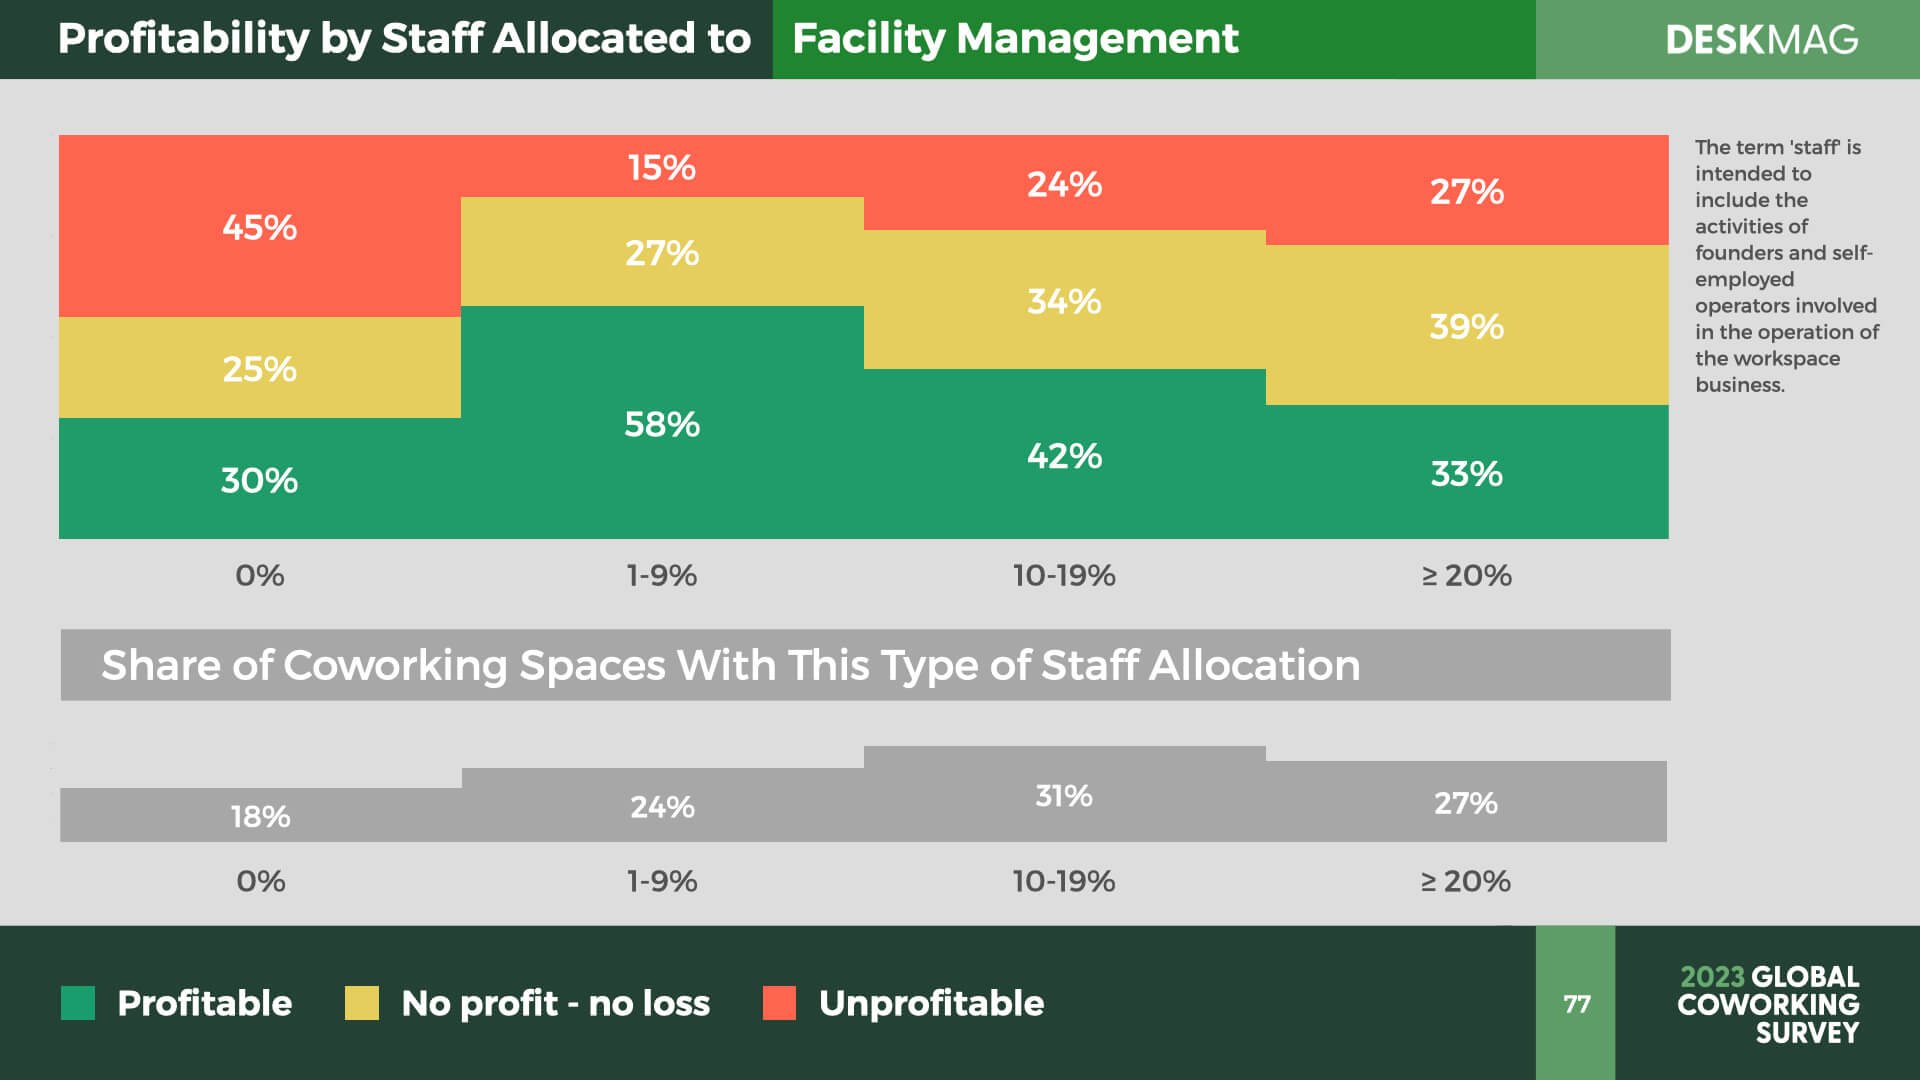
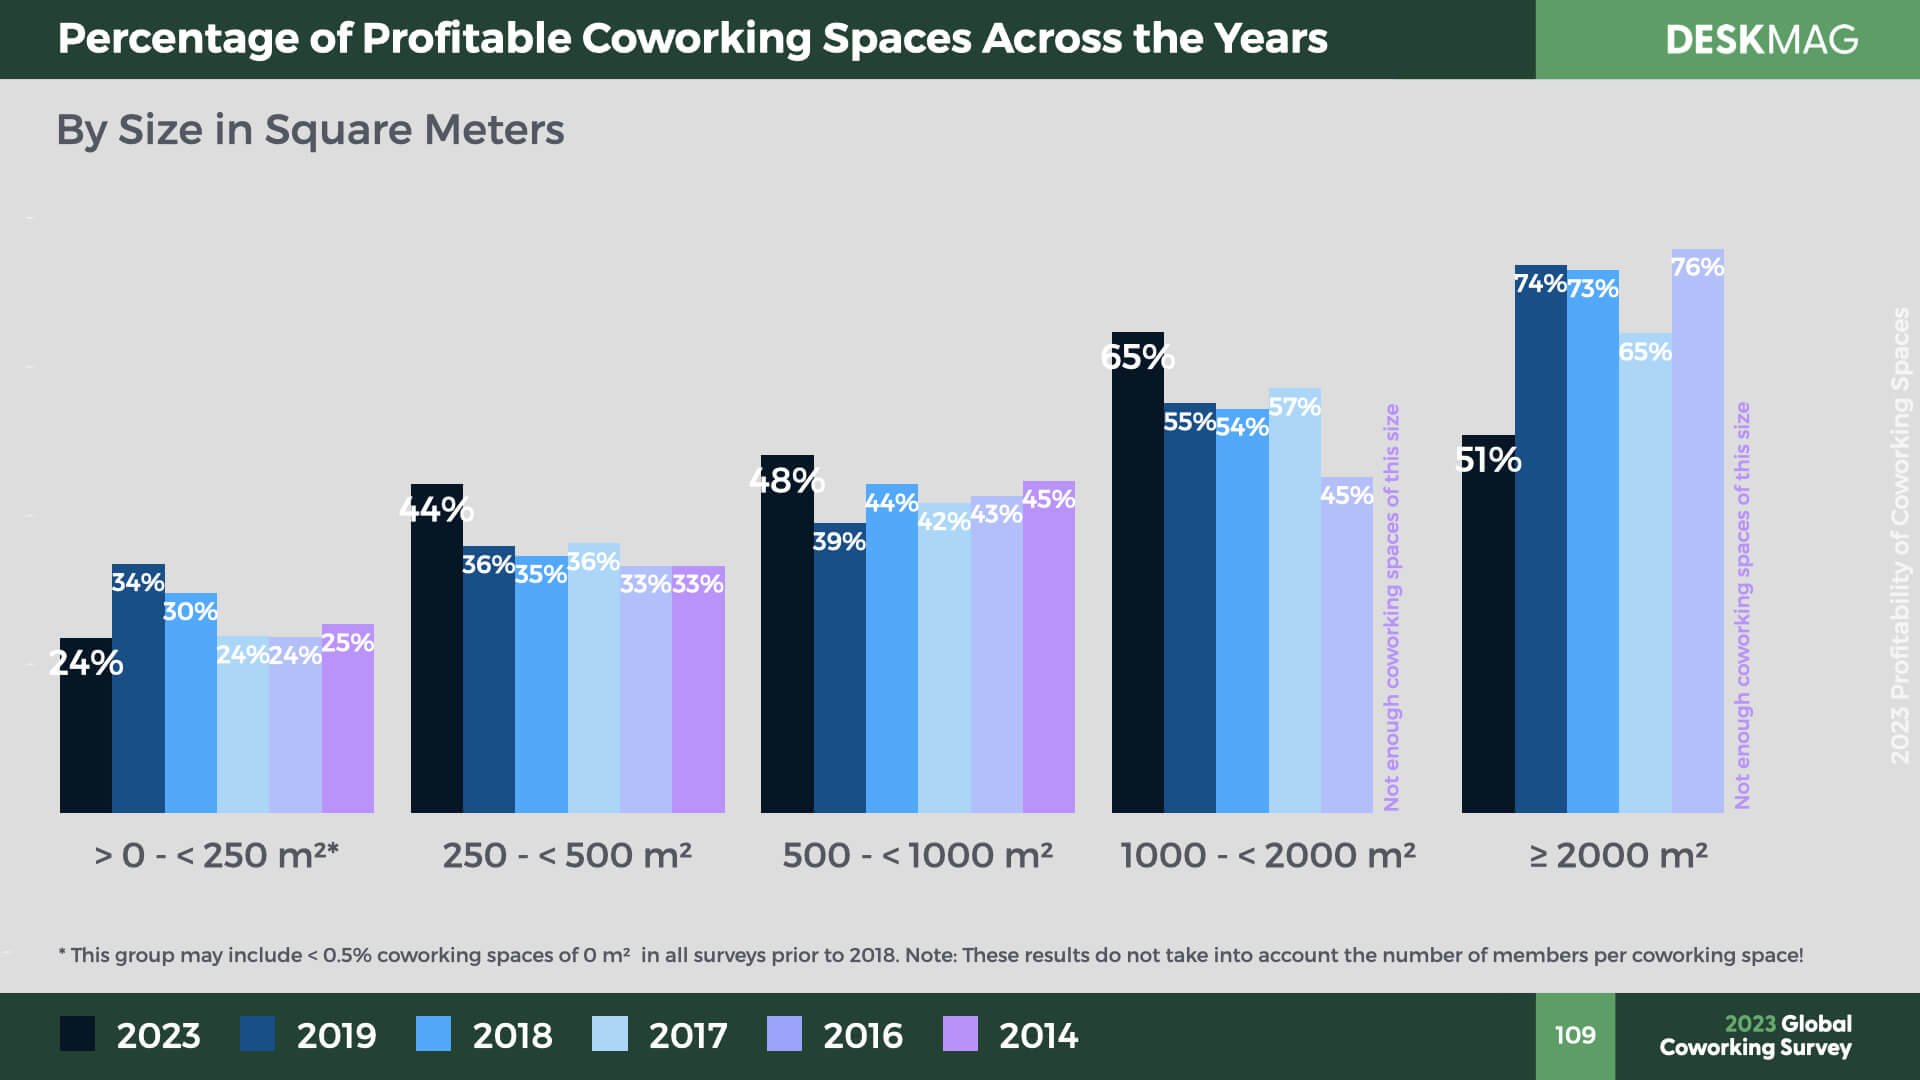
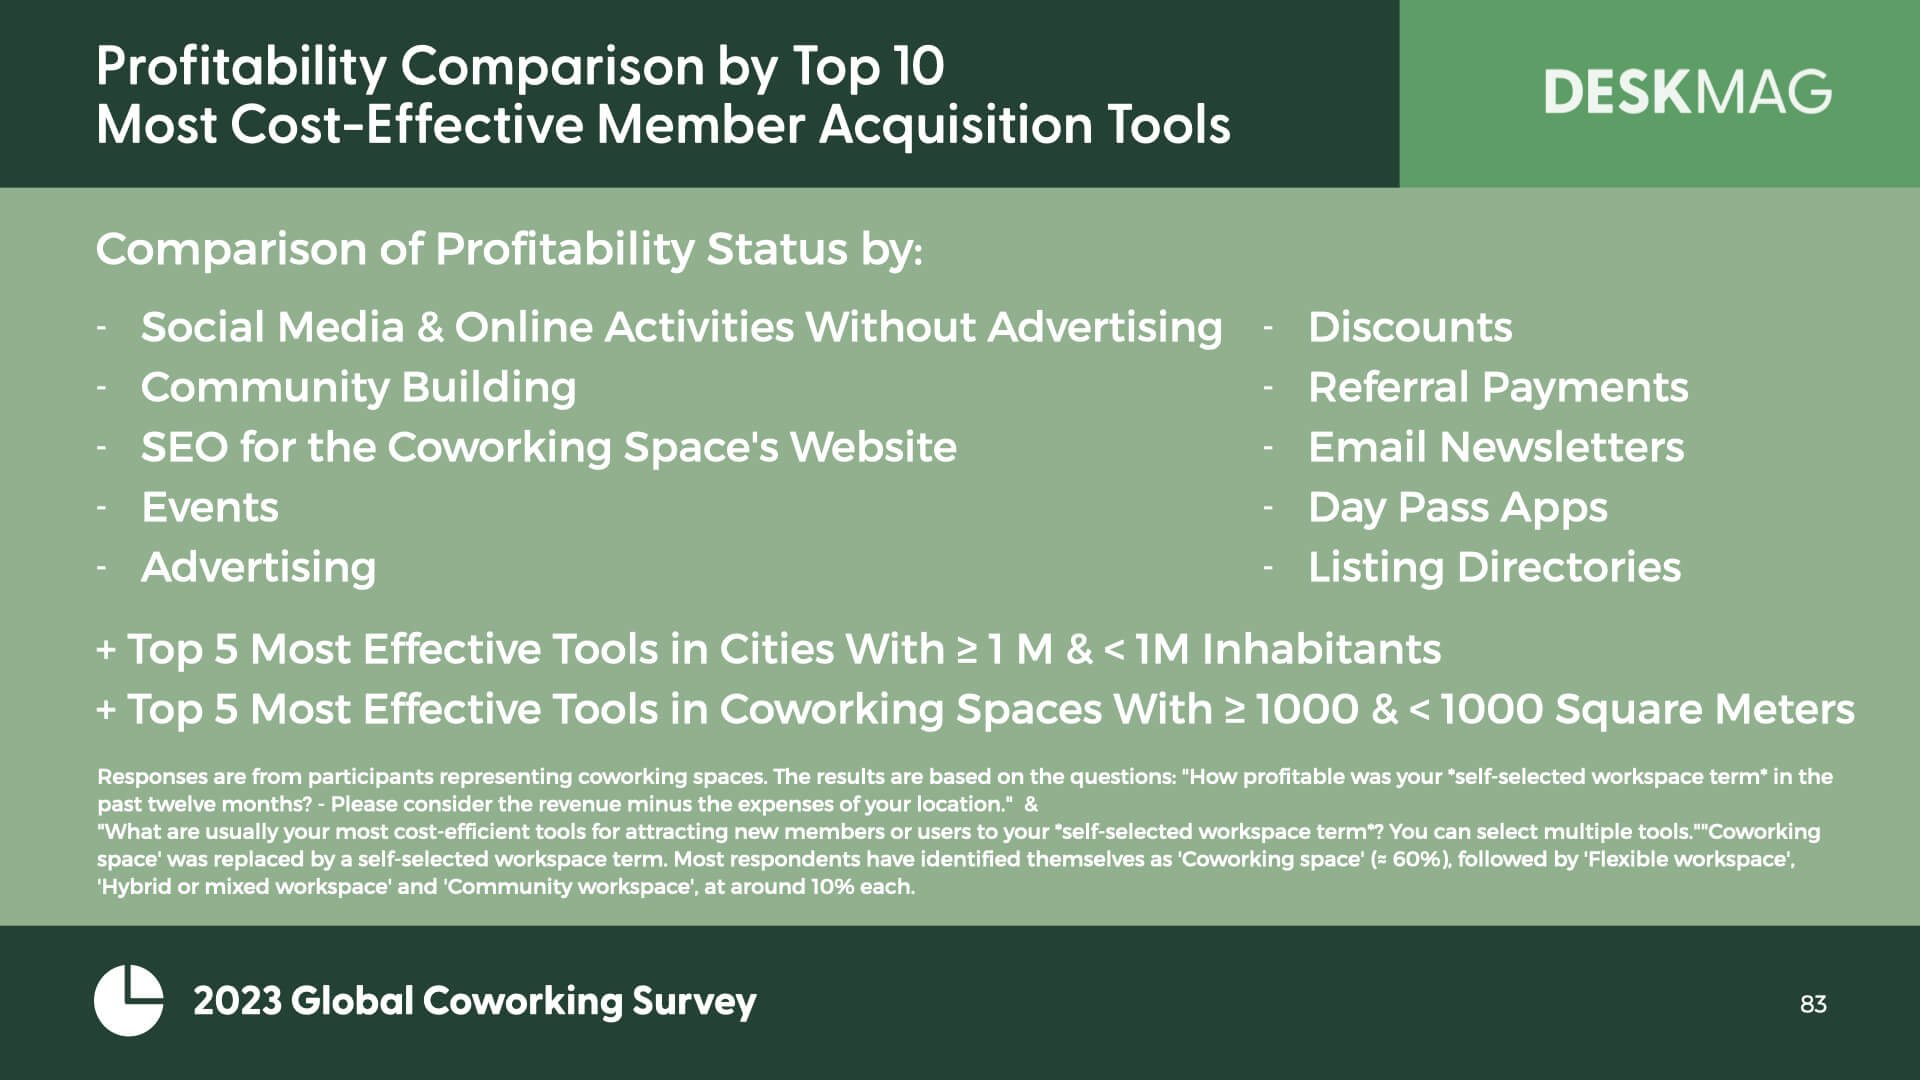
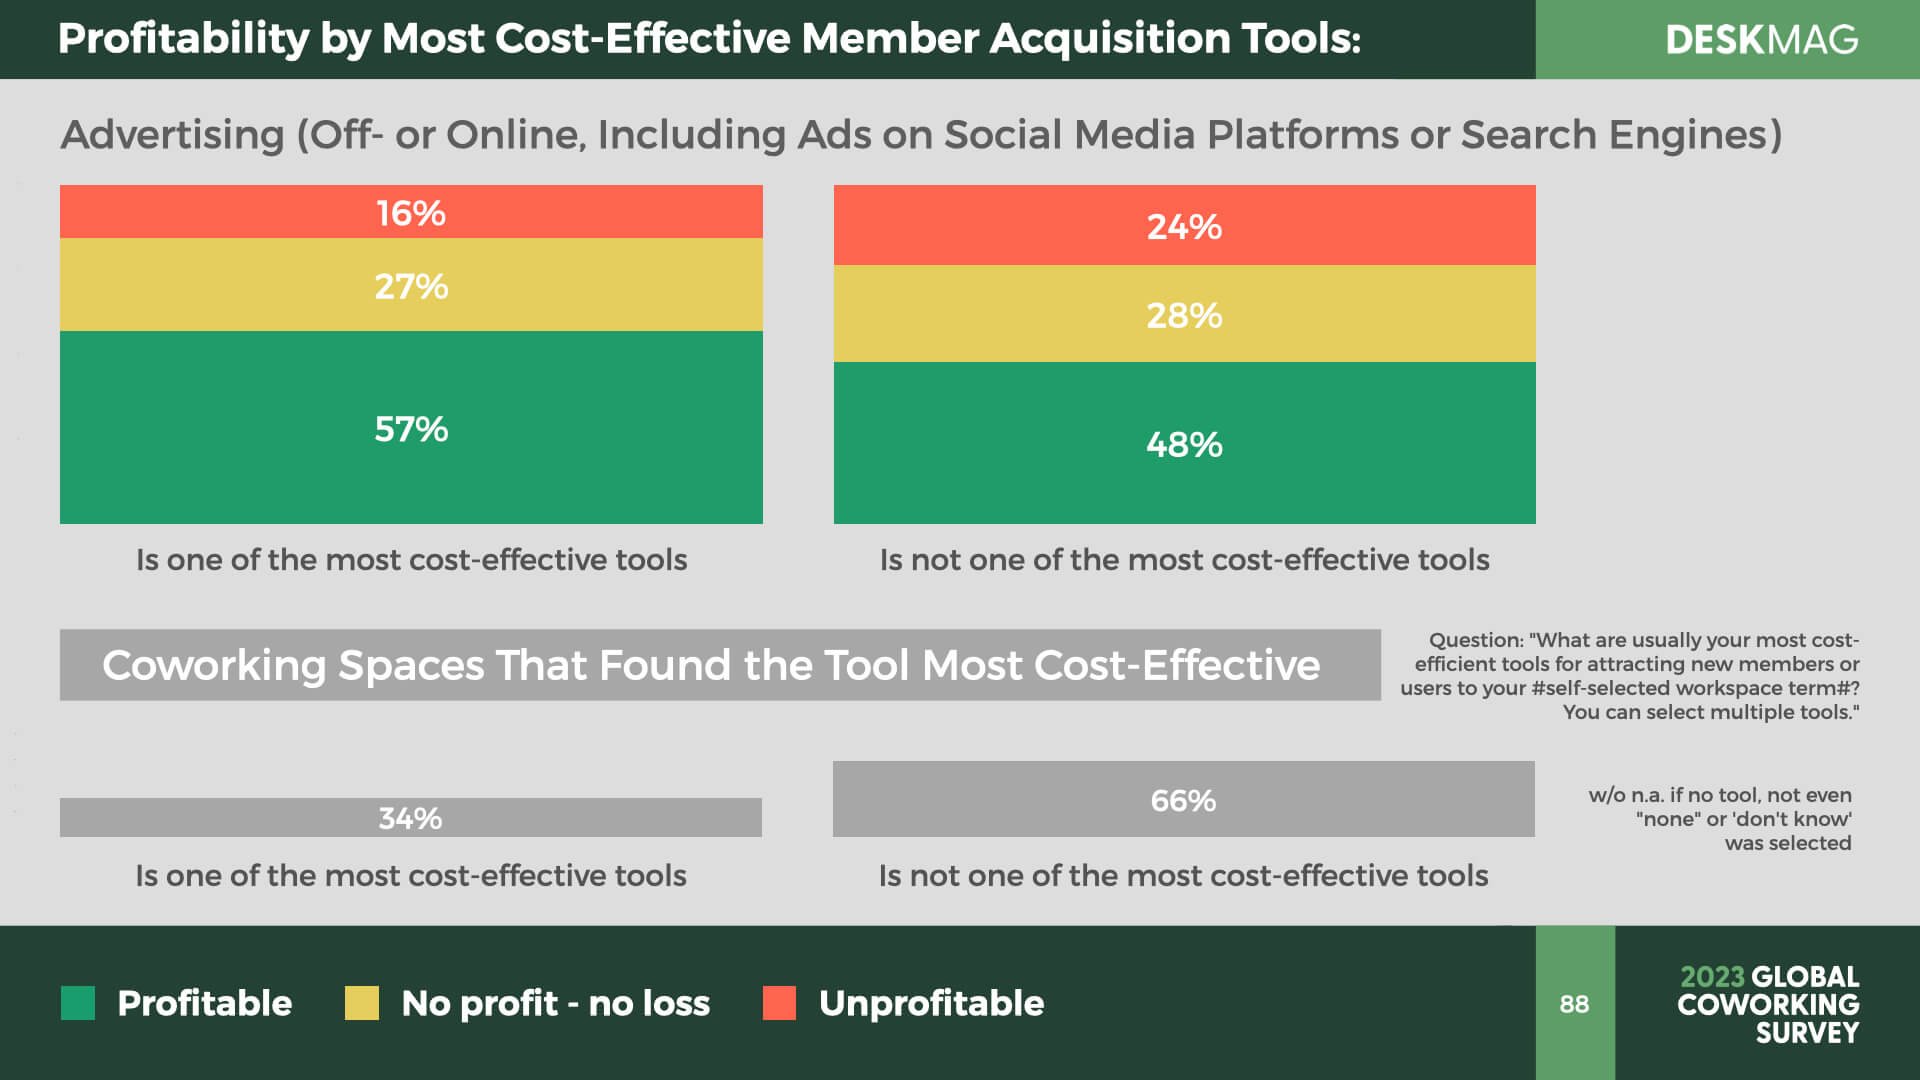
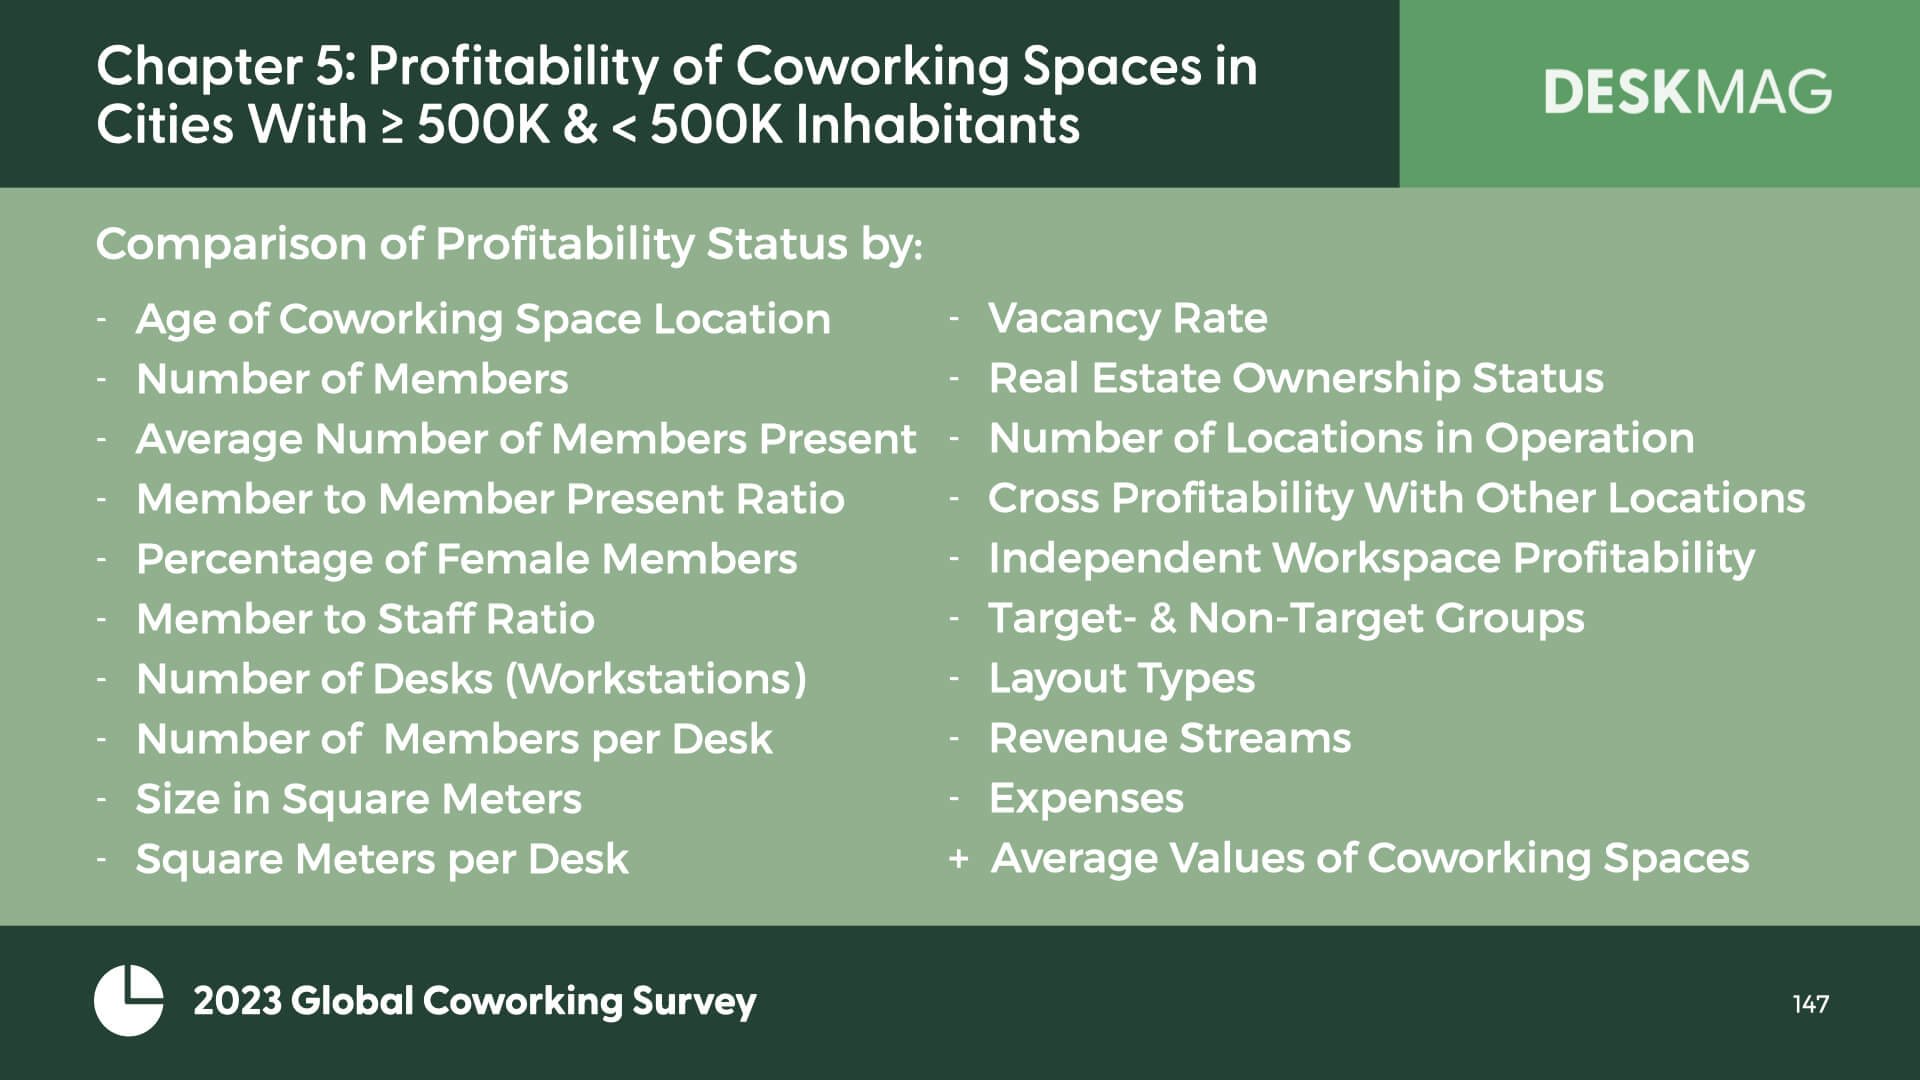
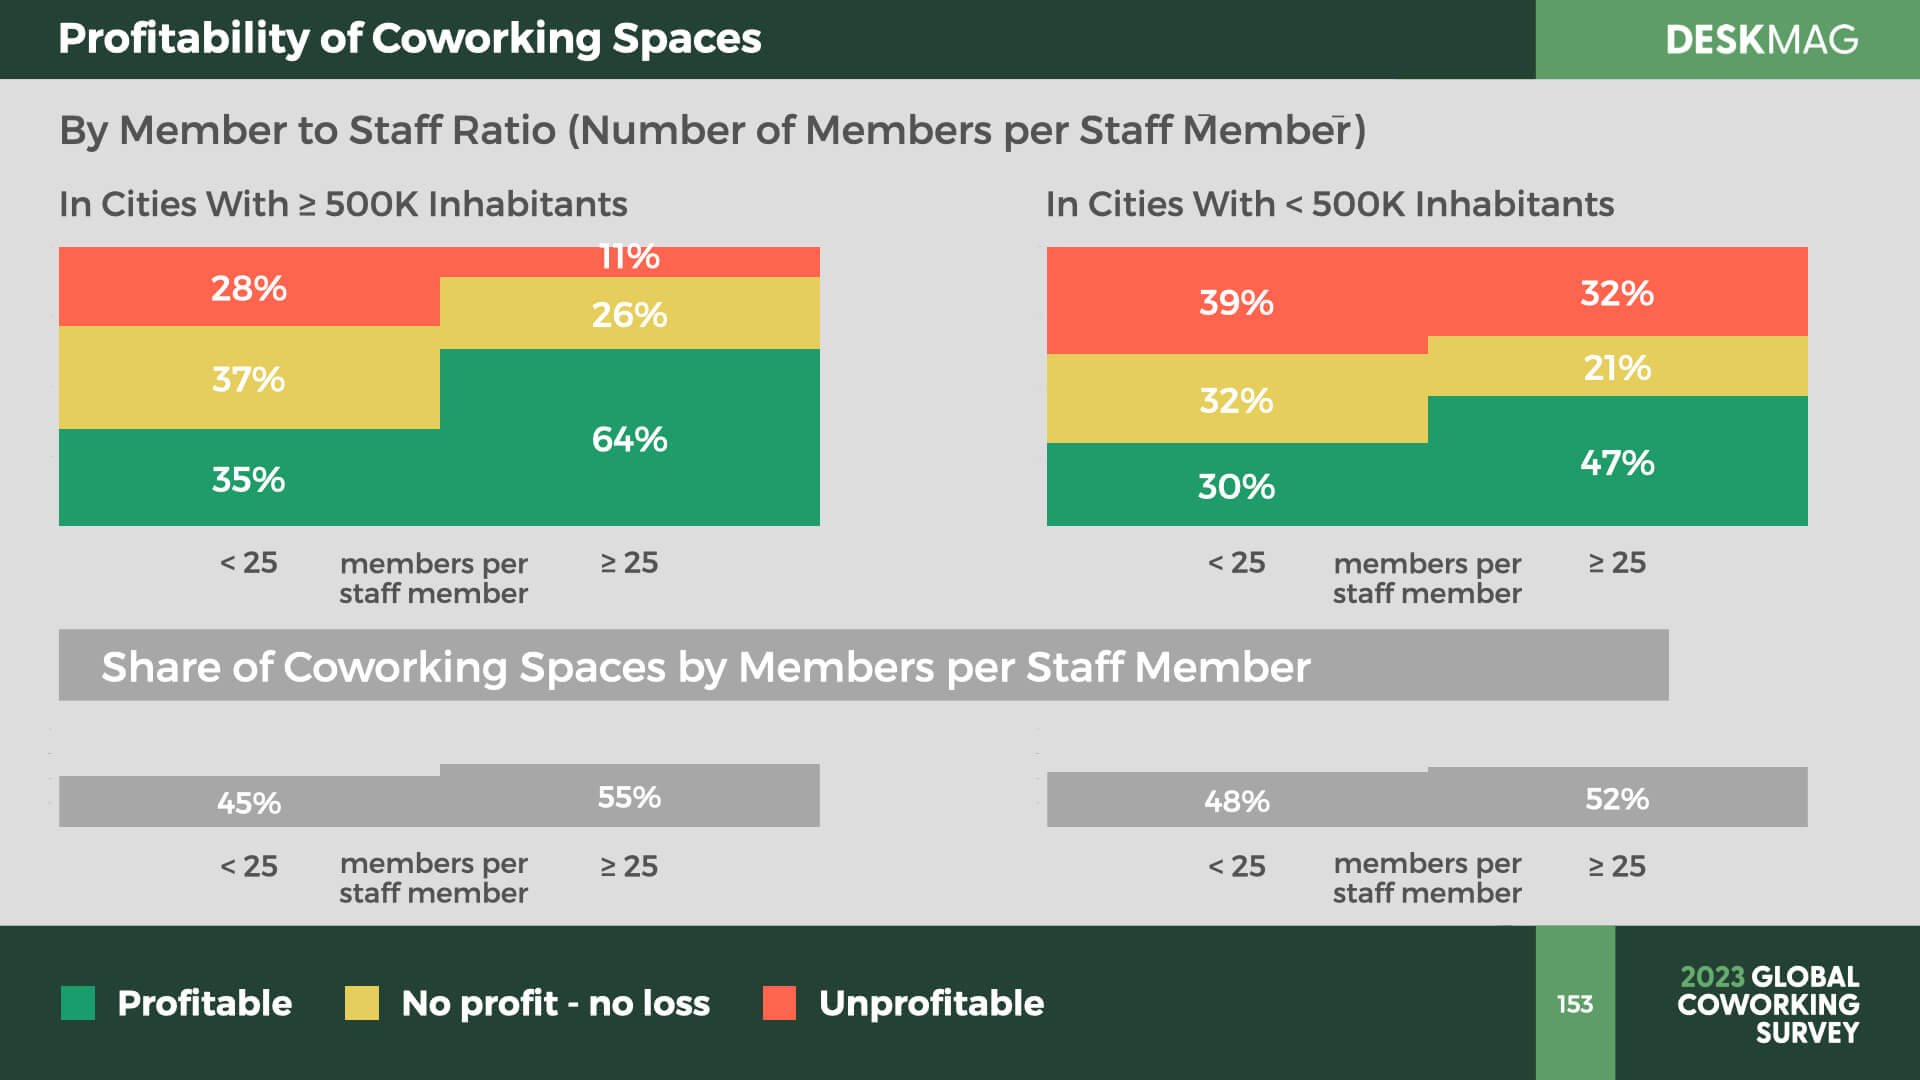
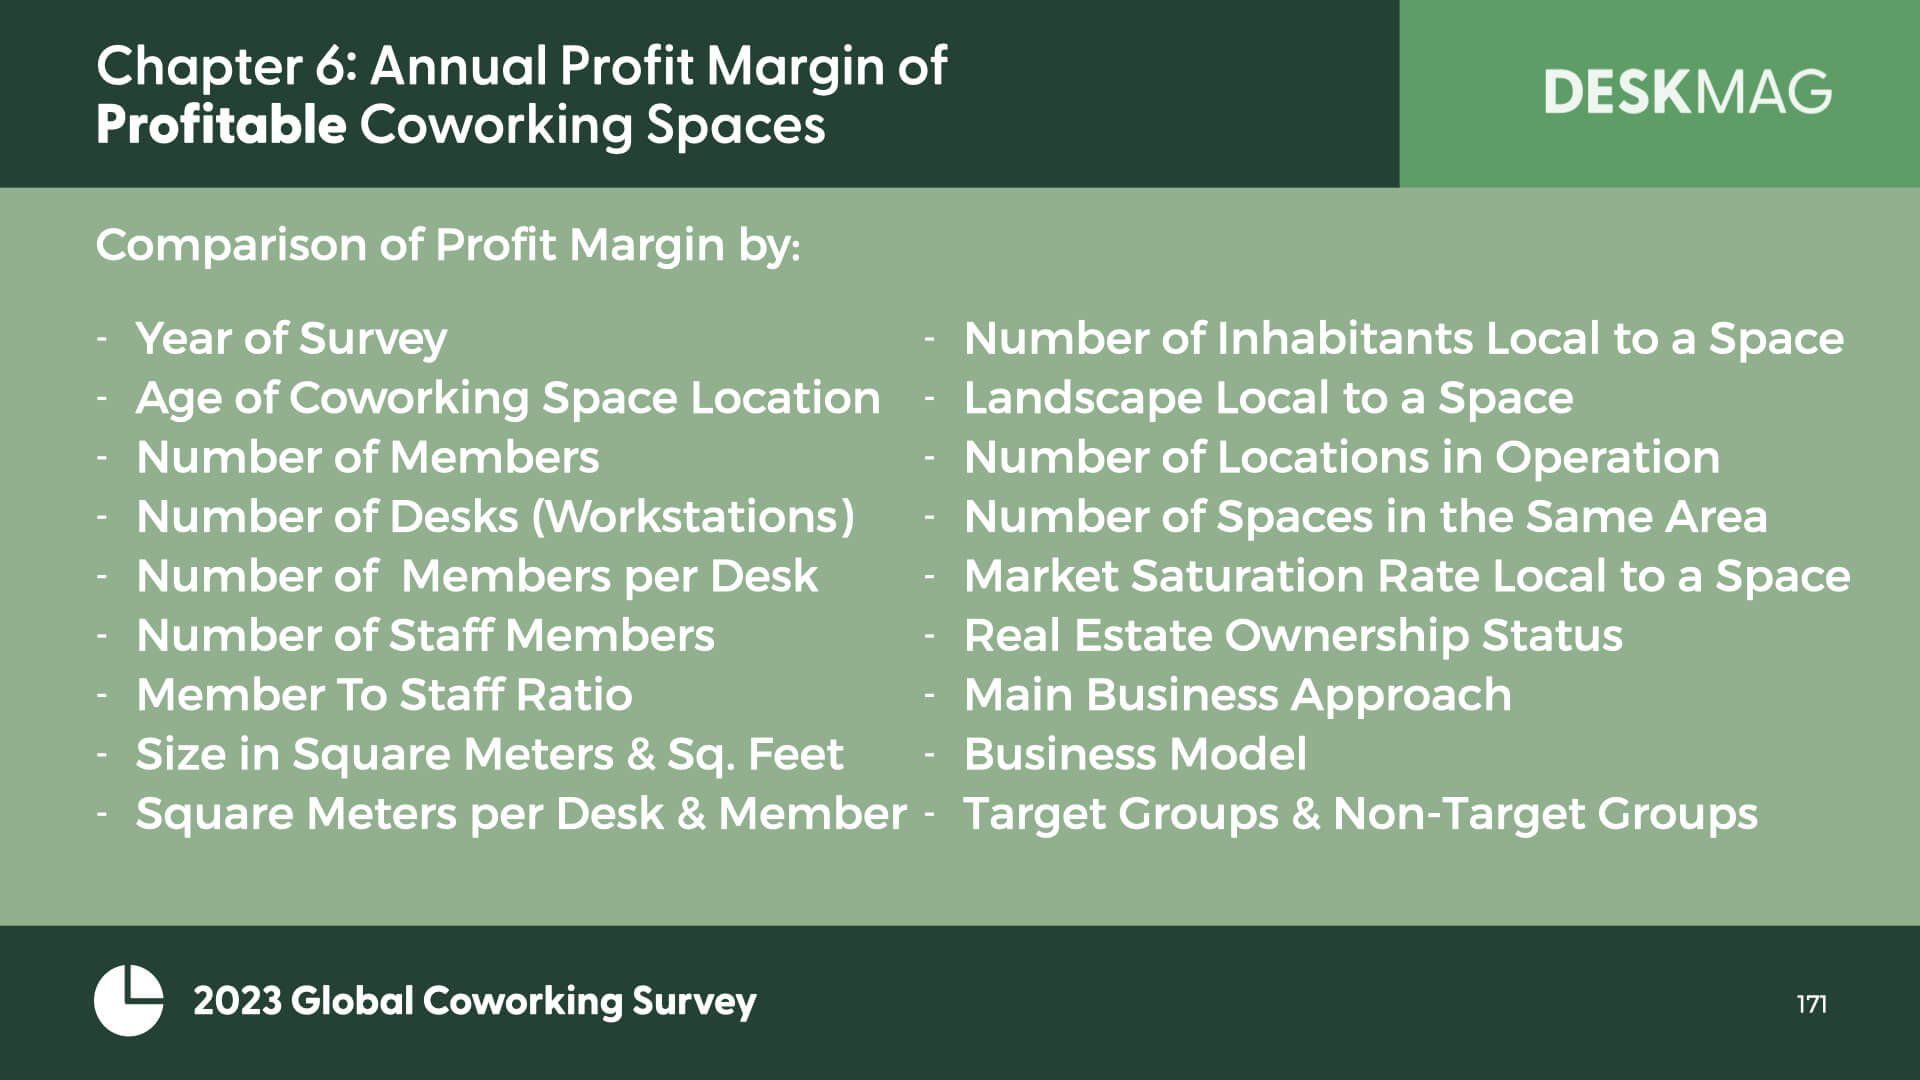
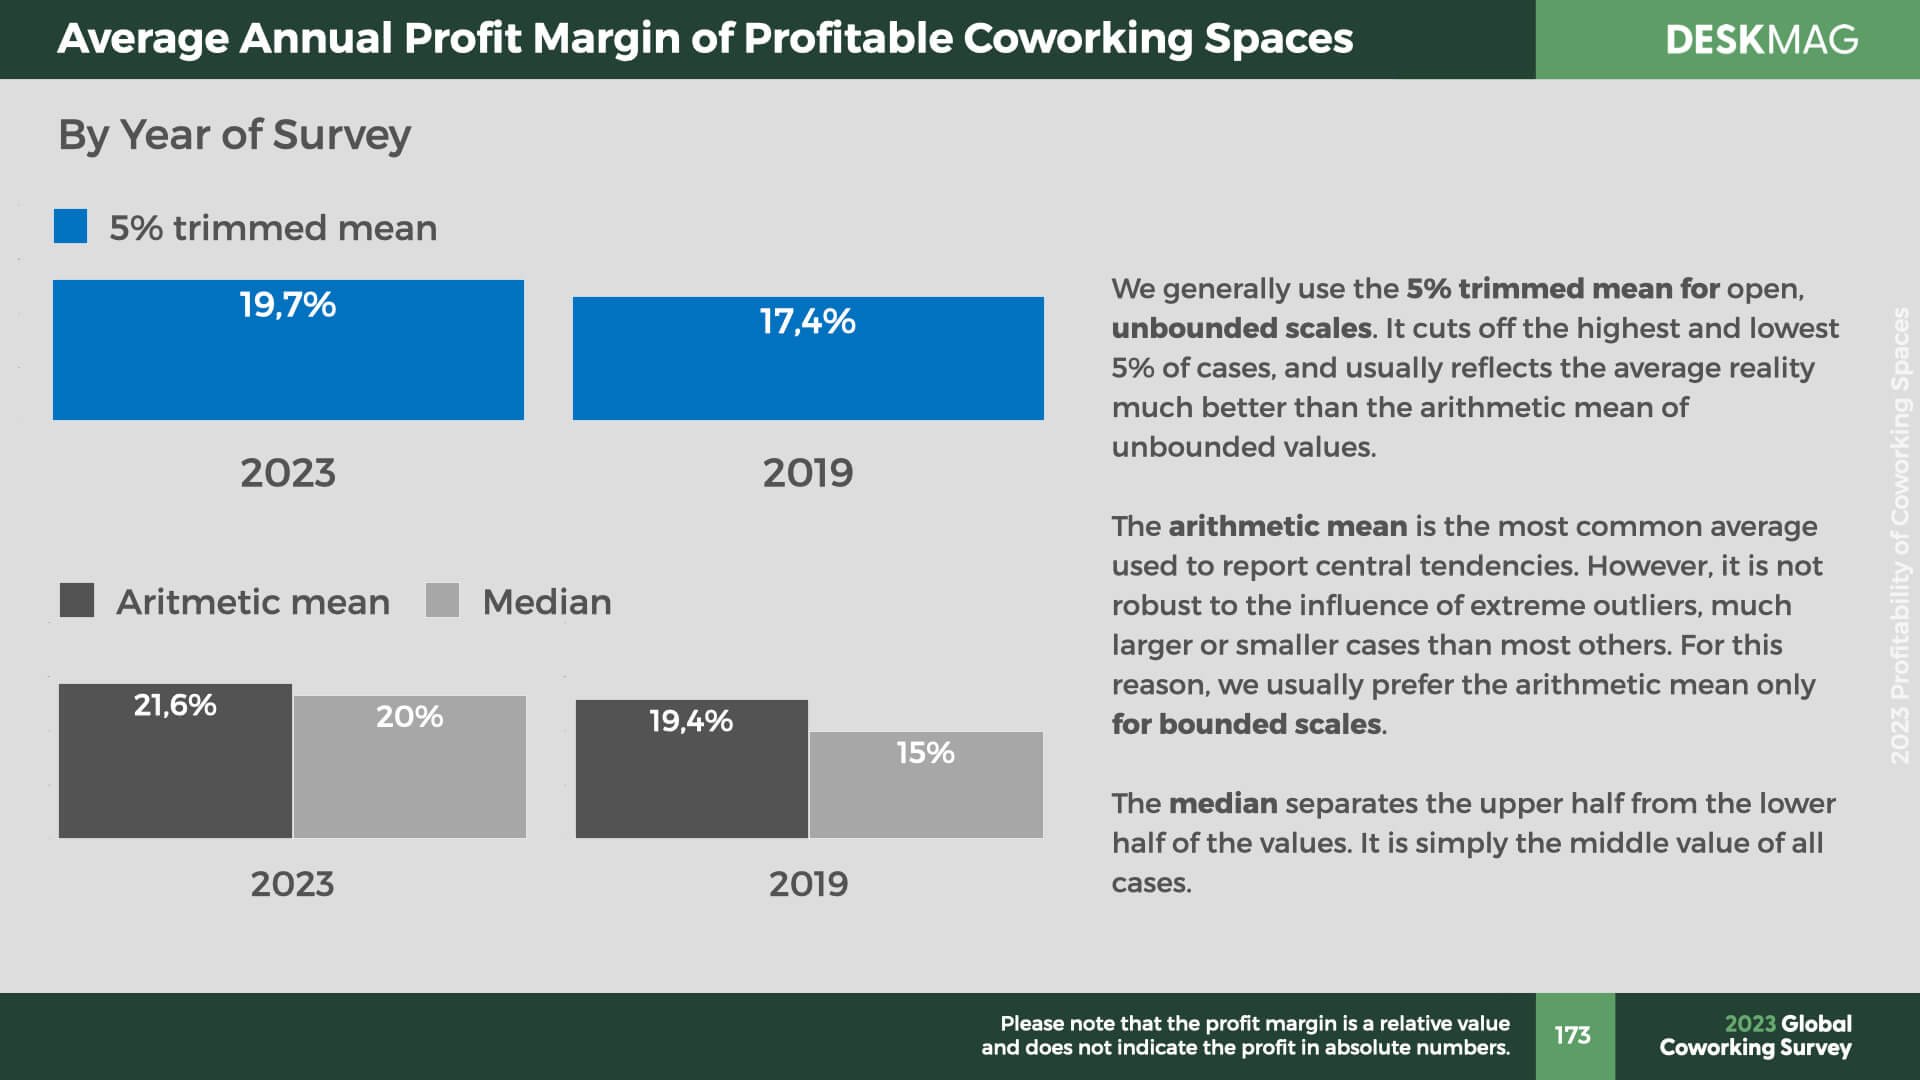
Table of Contents:
Chapter 1: Revenue Streams & Expenses of Coworking Spaces:
• Average Revenue Streams of Coworking Spaces Across the Years
• Share of Coworking Spaces That Generate Specific Revenue Streams• Average Expenses of Coworking Spaces Across the Years
• Share of Coworking Spaces That Generate Specific Expenses
Chapter 2: Profitability Comparison of Coworking Spaces by:
Year of Survey (+ of For-Profit Spaces)
Age of Coworking Space
Number of Members
Average Number of Members Present
Member to Member Present Ratio
Percentage of Female Members
Number of Desks (Workstations)
Number of Members per Desk
Number of Staff Members
Member To Staff Ratio
Size in Square Meters & Square Feet
Square Meters per Desk & per Member
Vacancy Rate
Real Estate Ownership Status
Business Model
Main Business Approach
Number of Locations in Operation
Cross Profitability With Other Locations
Requirement of Independent Coworking Space Profitability
Target Groups
Non-Target Groups
Time Commitment of Workspace Business Owners
PLUS:
Average Values of Coworking Spaces Compared by Profitability Status
Income of Owners & Employed Staff Compared by Profitability Status
Profitability Comparison by Environment of a Coworking Space - Comparison of Profitability Status by:
Number of Inhabitants Local to a Coworking Space
Landscape Local to a Coworking Space
Continent
Tourist Attractions Local to a Coworking Space
Number of Coworking Spaces in the Same City, Town or Village
Number of Coworking Spaces in the Same City With ≥ 1 M Inhabitants
Saturation Rate of Coworking Spaces
Saturation Rate of Coworking Spaces in Cities With ≥ 1 M Inhabitants
Profitability Comparison by Share of Expenses, Revenue Streams & Layout Types:
Share of Expenses of all Coworking Spaces Compared by Profitability + of Coworking Spaces That Rent a Location
Overview and Profitability Comparison by Share of Revenue From: Desk Rental, Private Office Rental, Meeting Space Rental & Combined Membership Plans
Overview and Profitability Comparison by Share of Layout by: Open Workspaces, Private Offices & Meeting Spaces
Profitability Comparison by Reported Problems:
Attracting New Members
High Real Estate or Rental Prices
Financial Constraints
High Energy Prices
Not Able To Provide Enough Workspace
Inflation
Not Able To Find Enough (Qualified) Staff
Lack of Community
Competition
Profitability Comparison by Staff Activities:
Average Percentages of Staff Activities Compared by Profitability Status
Comparison of Profitability Status by Percentage of Staff Allocated to:
Community & Hospitality Management
Facility Management
Operational Support
Sales
PR & Marketing
Business Development
Event Management
Profitability Comparison by Top 10 Most Cost-Effective Member Acquisition Tools:
Social Media & Online Activities Without Advertising
Community Building
SEO for the Coworking Space's Website
Events
Advertising
Discounts
Referral Payments
Email Newsletters
Day Pass Apps
Listing Directories
PLUS:
Top 5 Most Effective Tools in Cities With ≥ 1 M & < 1M Inhabitants
Top 5 Most Effective Tools in Coworking Spaces With ≥ 1000 & < 1000 Square Meters
Chapter 3: Profitable Coworking Spaces Across the Years
Comparison of Profitable Coworking Spaces by Year of Survey & by:
Average Expenses + of Those That Rent a Location
Average Revenue Streams
Average Layout Types
Percentage of Profitable Coworking Spaces Compared by Year of Survey & by:
Age of Coworking Spaces
Number of Members
Number of Desks
Members To Desk Ratio
Members To Staff Ratio
Size in Square Meters
Square Meters per Desk
Continent
Number of Inhabitants
Market Saturation Rate
Business Model
Requirement of Independent Coworking Space Profitability
The results in the 2023 survey are based on the question: "How profitable was your *self-selected workspace term* in the past twelve months? - Please consider the revenue minus the expenses of your location." In previous surveys, the question was based on either the past twelve months (2019), the current calendar year if the survey was conducted at the end of the year, or the previous calendar year if the survey was conducted at the beginning of a calendar year to account for the past twelve months.
Please note: 'Coworking space' was replaced by a self-selected workspace term in the 2023 survey. Most respondents have identified themselves as 'Coworking space' (≈ 60%), followed by 'Flexible workspace', 'Hybrid or mixed workspace' and 'Community workspace', at around 10% each.
The response options were simplified in the 2023 survey to "profitable" (2019 & earlier: "very profitable" and "rather profitable"), "no profit, no loss" and "unprofitable" (2019 & earlier: "rather unprofitable" and "very unprofitable").
Chapter 4: Profitability of For-Profit Coworking Spaces That Are > 1 Year Old
Comparison of Profitability Status by:
Year of Survey
Age of Coworking Space
Number of Members
Average Number of Members Present
Member to Member Present Ratio
Member To Staff Ratio
Percentage of Female Members
Number of Desks (Workstations)
Number of Members per Desk
Size in Square Meters
Size in Square Feet
Square Meters per Desk
Square Meters per Member
Vacancy Rate
Real Estate Ownership Status
Summarized Main Business Approaches
Number of Locations in Operation
Cross Profitability With Other Locations
Independent Workspace Profitability
Target-Groups
Non-Target Groups
Time Commitment of Workspace Owners
Layout Types
Revenue Streams
Expenses (+ Expenses of Coworking Spaces That Rent a Location)
PLUS:
Average Values of For-Profit Coworking Spaces That Are > 1 Year Old
Chapter 5: Profitability of Coworking Spaces in Cities With ≥ 500K & < 500K Inhabitants
Comparison of Profitability Status by:
Age of Coworking Space Location
Number of Members
Average Number of Members Present
Member to Member Present Ratio
Percentage of Female Members
Member to Staff Ratio
Number of Desks (Workstations)
Number of Members per Desk
Size in Square Meters
Square Meters per Desk
Vacancy Rate
Real Estate Ownership Status
Number of Locations in Operation
Cross Profitability With Other Locations
Independent Workspace Profitability
Target- & Non-Target Groups
Layout Types
Revenue Streams
Expenses
PLUS:
Average Values of Coworking Spaces
Chapter 6: Annual Profit Margin of Profitable Coworking Spaces
Comparison of Profit Margin by:
Year of Survey
Age of Coworking Space Location
Number of Members
Number of Desks (Workstations)
Number of Members per Desk
Number of Staff Members
Member To Staff Ratio
Size in Square Meters
Size in Square Feet
Square Meters per Desk
Square Meters per Member
Number of Inhabitants Local to a Coworking Space
Landscape Local to a Coworking Space
Number of Locations in Operation
Number of Coworking Spaces in the Same Area
Market Saturation Rate Local to a Coworking Space
Real Estate Ownership Status
Main Business Approach
Business Model
Target Groups & Non-Target Groups
Comparison of:
Average Expenses of Those That Rent a Location by Profit Margin
Average Revenue Streams by Profit Margin
Average Layout Types by Profit Margin
PLUS:
Average Values of Profitable Coworking Spaces by Profit Margin
Please keep in mind:
The profit margin is a relative value and says nothing about the profit in absolute numbers!
The highest margins are often achieved by smaller coworking spaces that do not generate a high absolute profit compared to other coworking spaces and are also often in groups that otherwise have a higher percentage of unprofitable coworking spaces, as shown in the previous slides.
For this reason, it is essential to remember that only profitable coworking spaces are shown in the charts. Including unprofitable coworking spaces would significantly change the average profit margin and the group comparison.
